It feels like I’ve been doing curl forever, while in fact it is “only” in its early teens. I decided to dig up some numbers on how the development have been within the project over the last decade. How have things changed during the 10 most recent years.
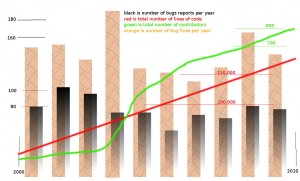
To spice up the numbers, I generated some graphs based on them and to then make the graphs nice and presentable I moved them all over to a single graph using my super gimp powers.
Click the image to get a full resolution version. But even the small one shows the data I wanted to illustrate: we gain contributors in roughly the same speed as we grow in lines of code. And at the same time we get roughly the same amount of bug reports over the years, apparently independently from the amount of code and contributors! Note that I separate the bug fixed bars from the bug report bars because bug fixed is the amount of bugfixes mentioned in release notes while the bug reports is the count in the web based bug tracker. As seen we fixed a lot more bugs than we get submitted in the bug tracker.
I should add that the reason the green contributor line starts out a little slow and gets a speed bump after a while, is that I changed my way of working at that point and got much better at tracking exactly all contributors. The general angle on the curve for the last 4-5 years is however what I think is the interesting part of it. How it is basically the same angle as the source code increase.
The bug report counter is merely taken from our bug tracker at sourceforge, which is a very inexact count as a very large amount of bugs are reported on the mailing lists only.
Data from the curl release table, tells that during these 10 years we’ve done 77 releases in which we fixed 1414 bugs. That’s 18.4 bug fixes per release and one release roughly every 47 days on average. 141 bug fixes per year on average.
To see how this development has changed over time I decided to compare those numbers against those for the most recent 2.5 years. During this most recent 25% of the period we’ve done releases every 60 days on average but counting 155 bug fixes per year. Which made that the average number of bug fixes per release have gone up to 26; one bugfix every 2.3 days.
A more negative interpretation on this could be that we’re only capable of a certain amount of bug fixes per time so no matter how much code we get we fix bugs at roughly the same rate. The fact that we don’t get any increasing amount of bug reports of course speaks against this theory.

