

The curl project moved over its source code hosting to GitHub in March 2010, but we kept the main bug tracker running like before – on Sourceforge.
It took us a few years, but in 2015 we finally ditched the Sourceforge version fully. We adopted and switched over to the pull request model and we labeled the GitHub issue tracker the official one to use for curl bugs. Announced on the curl website proper on March 9 2015.
GitHub holds issues and pull requests in the same number series, and since a few years back they also added discussions to the mix. This number is another pointless one, but it is large and even so let’s celebrate it!
Issue one in curl’s GitHub repository is from October 2010.
Issue 100 is from May 18, 2014.
Issue 500 is from Oct 20, 2015.
Issue 10,000 was created November 29, 2022. That meant 9,500 issues created in 2,597 days. 3.7 issues/day on average over seven years.
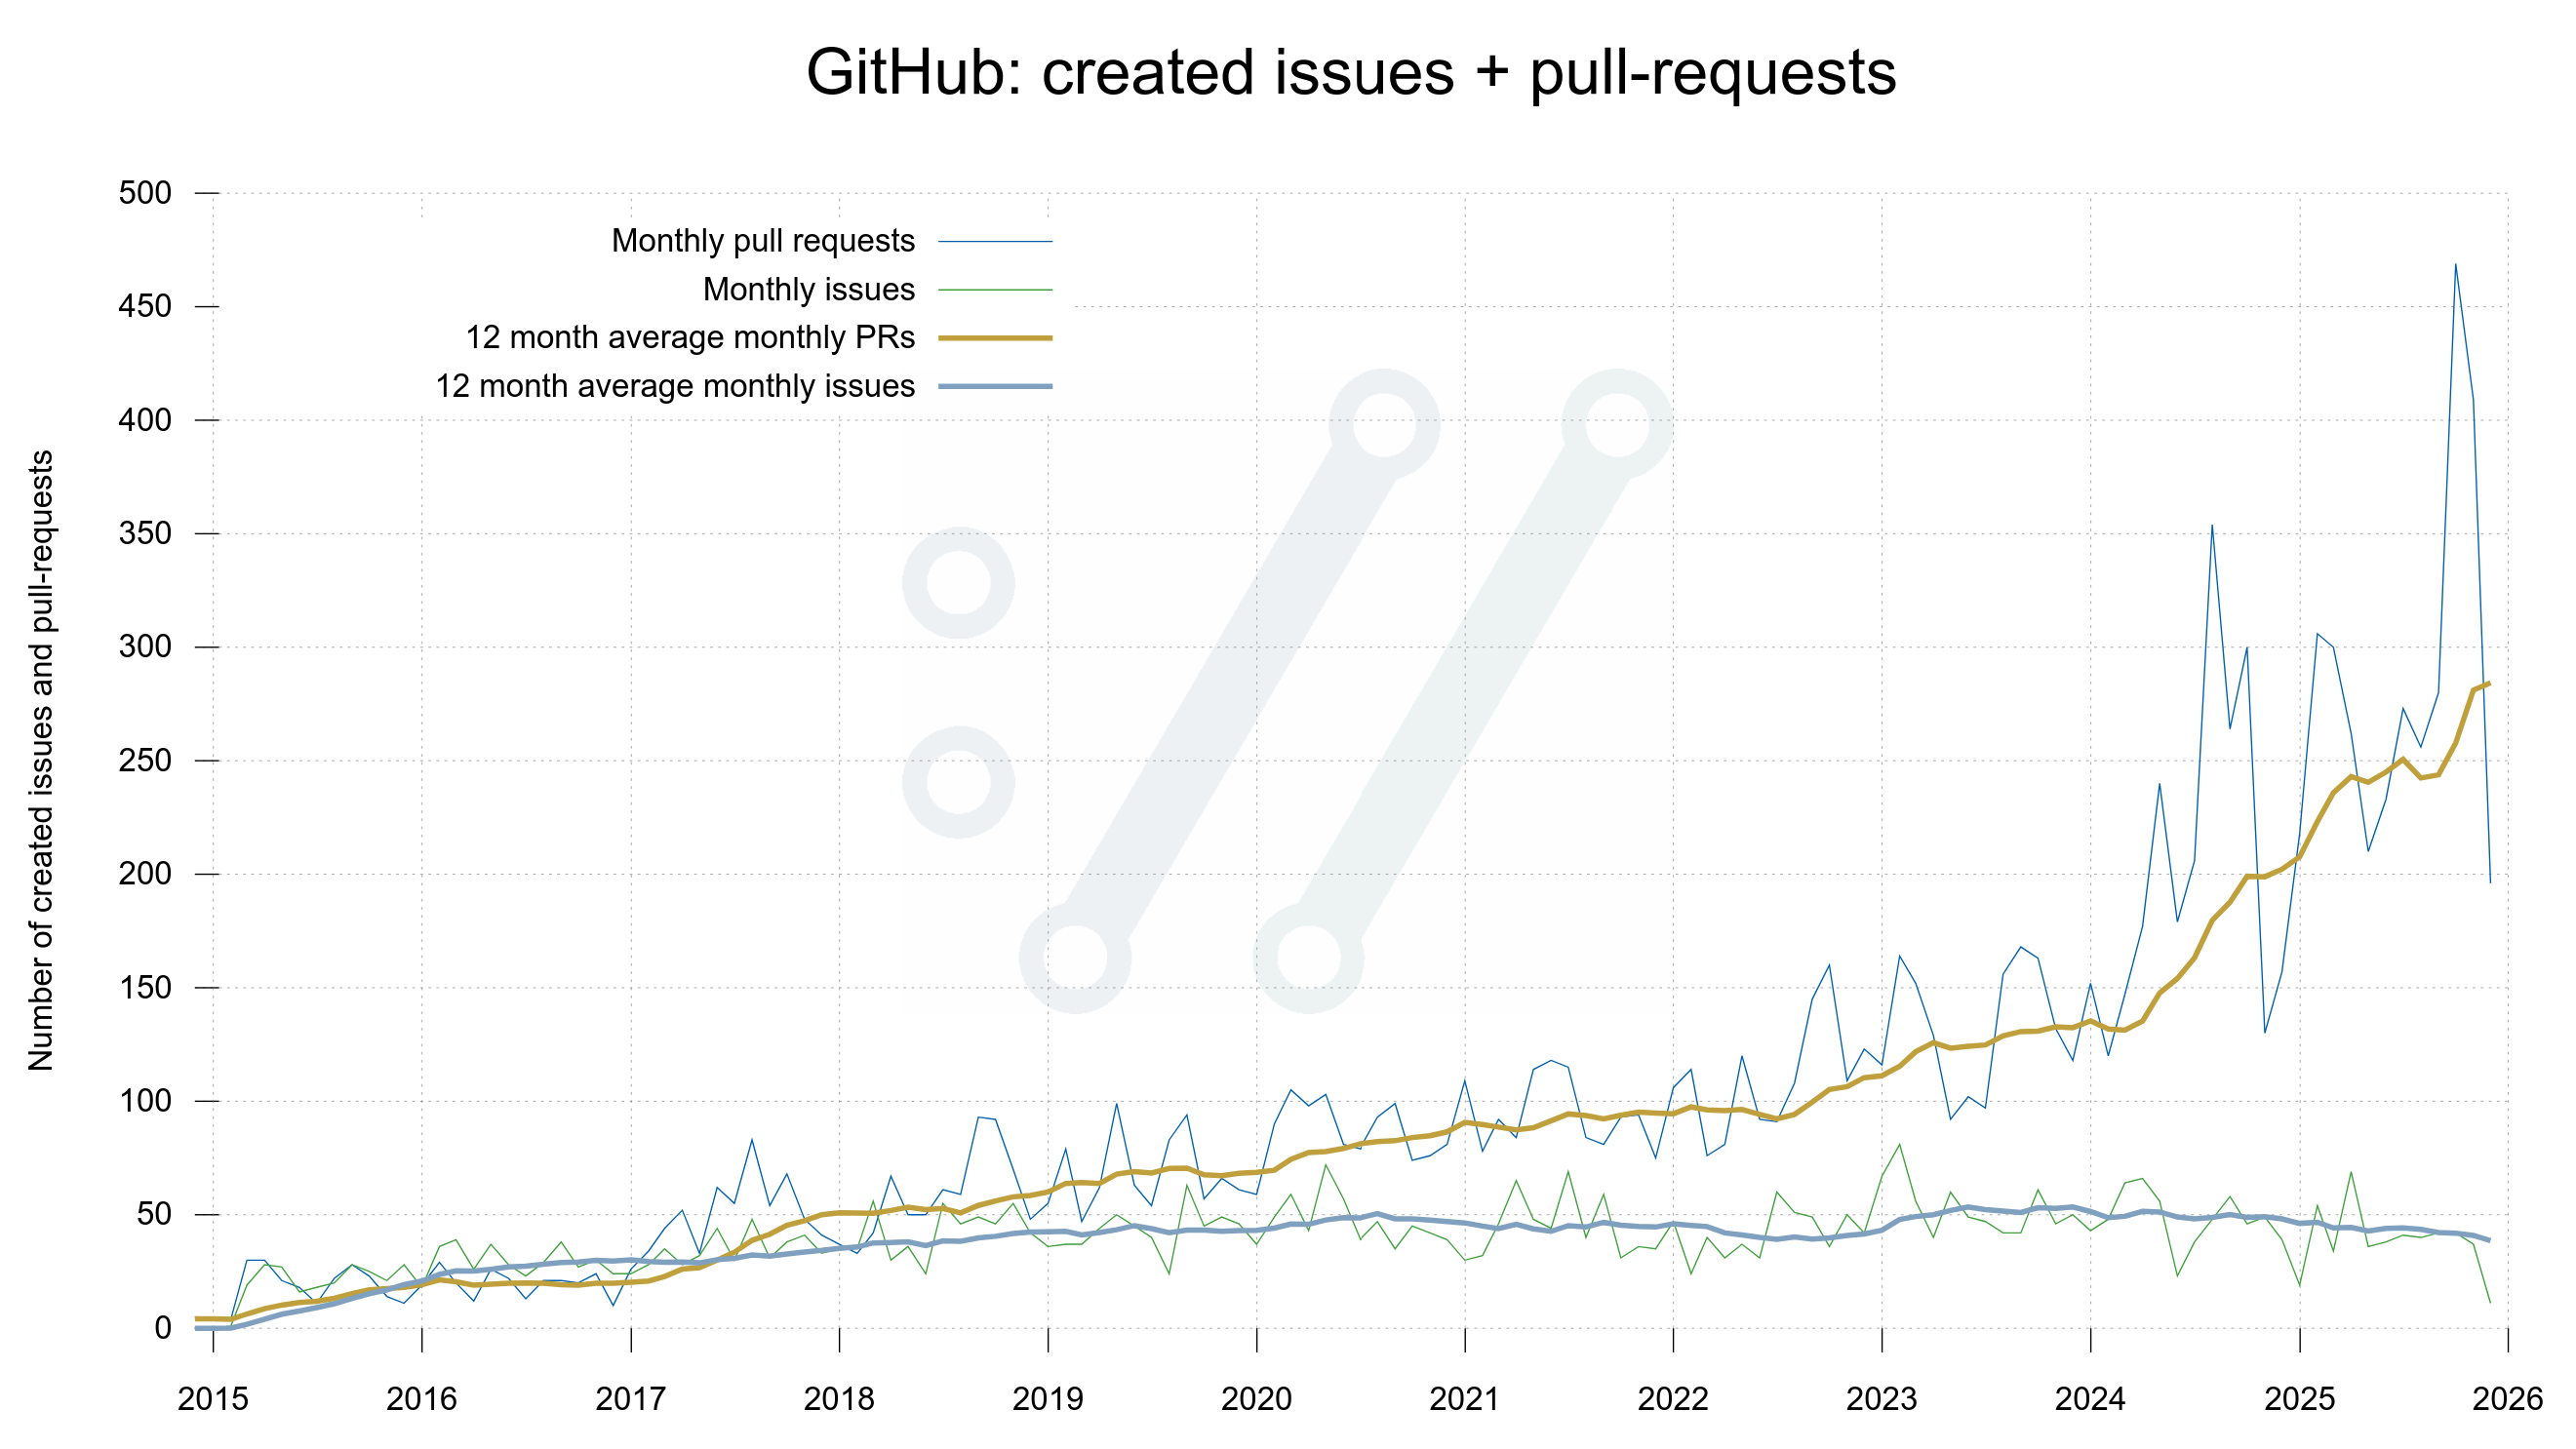
Issue 20,000 (a pull request really) was created today, on December 16, 2025. 10,000 more issues created in 1,113 days. 9 issues/day over the last three years.
The pace of which primarily new pull requests are submitted has certainly gone up over the recent years, as this graph clearly shows. (Since the current month is only half so far, the drop at the right end of the plot is quite expected.)
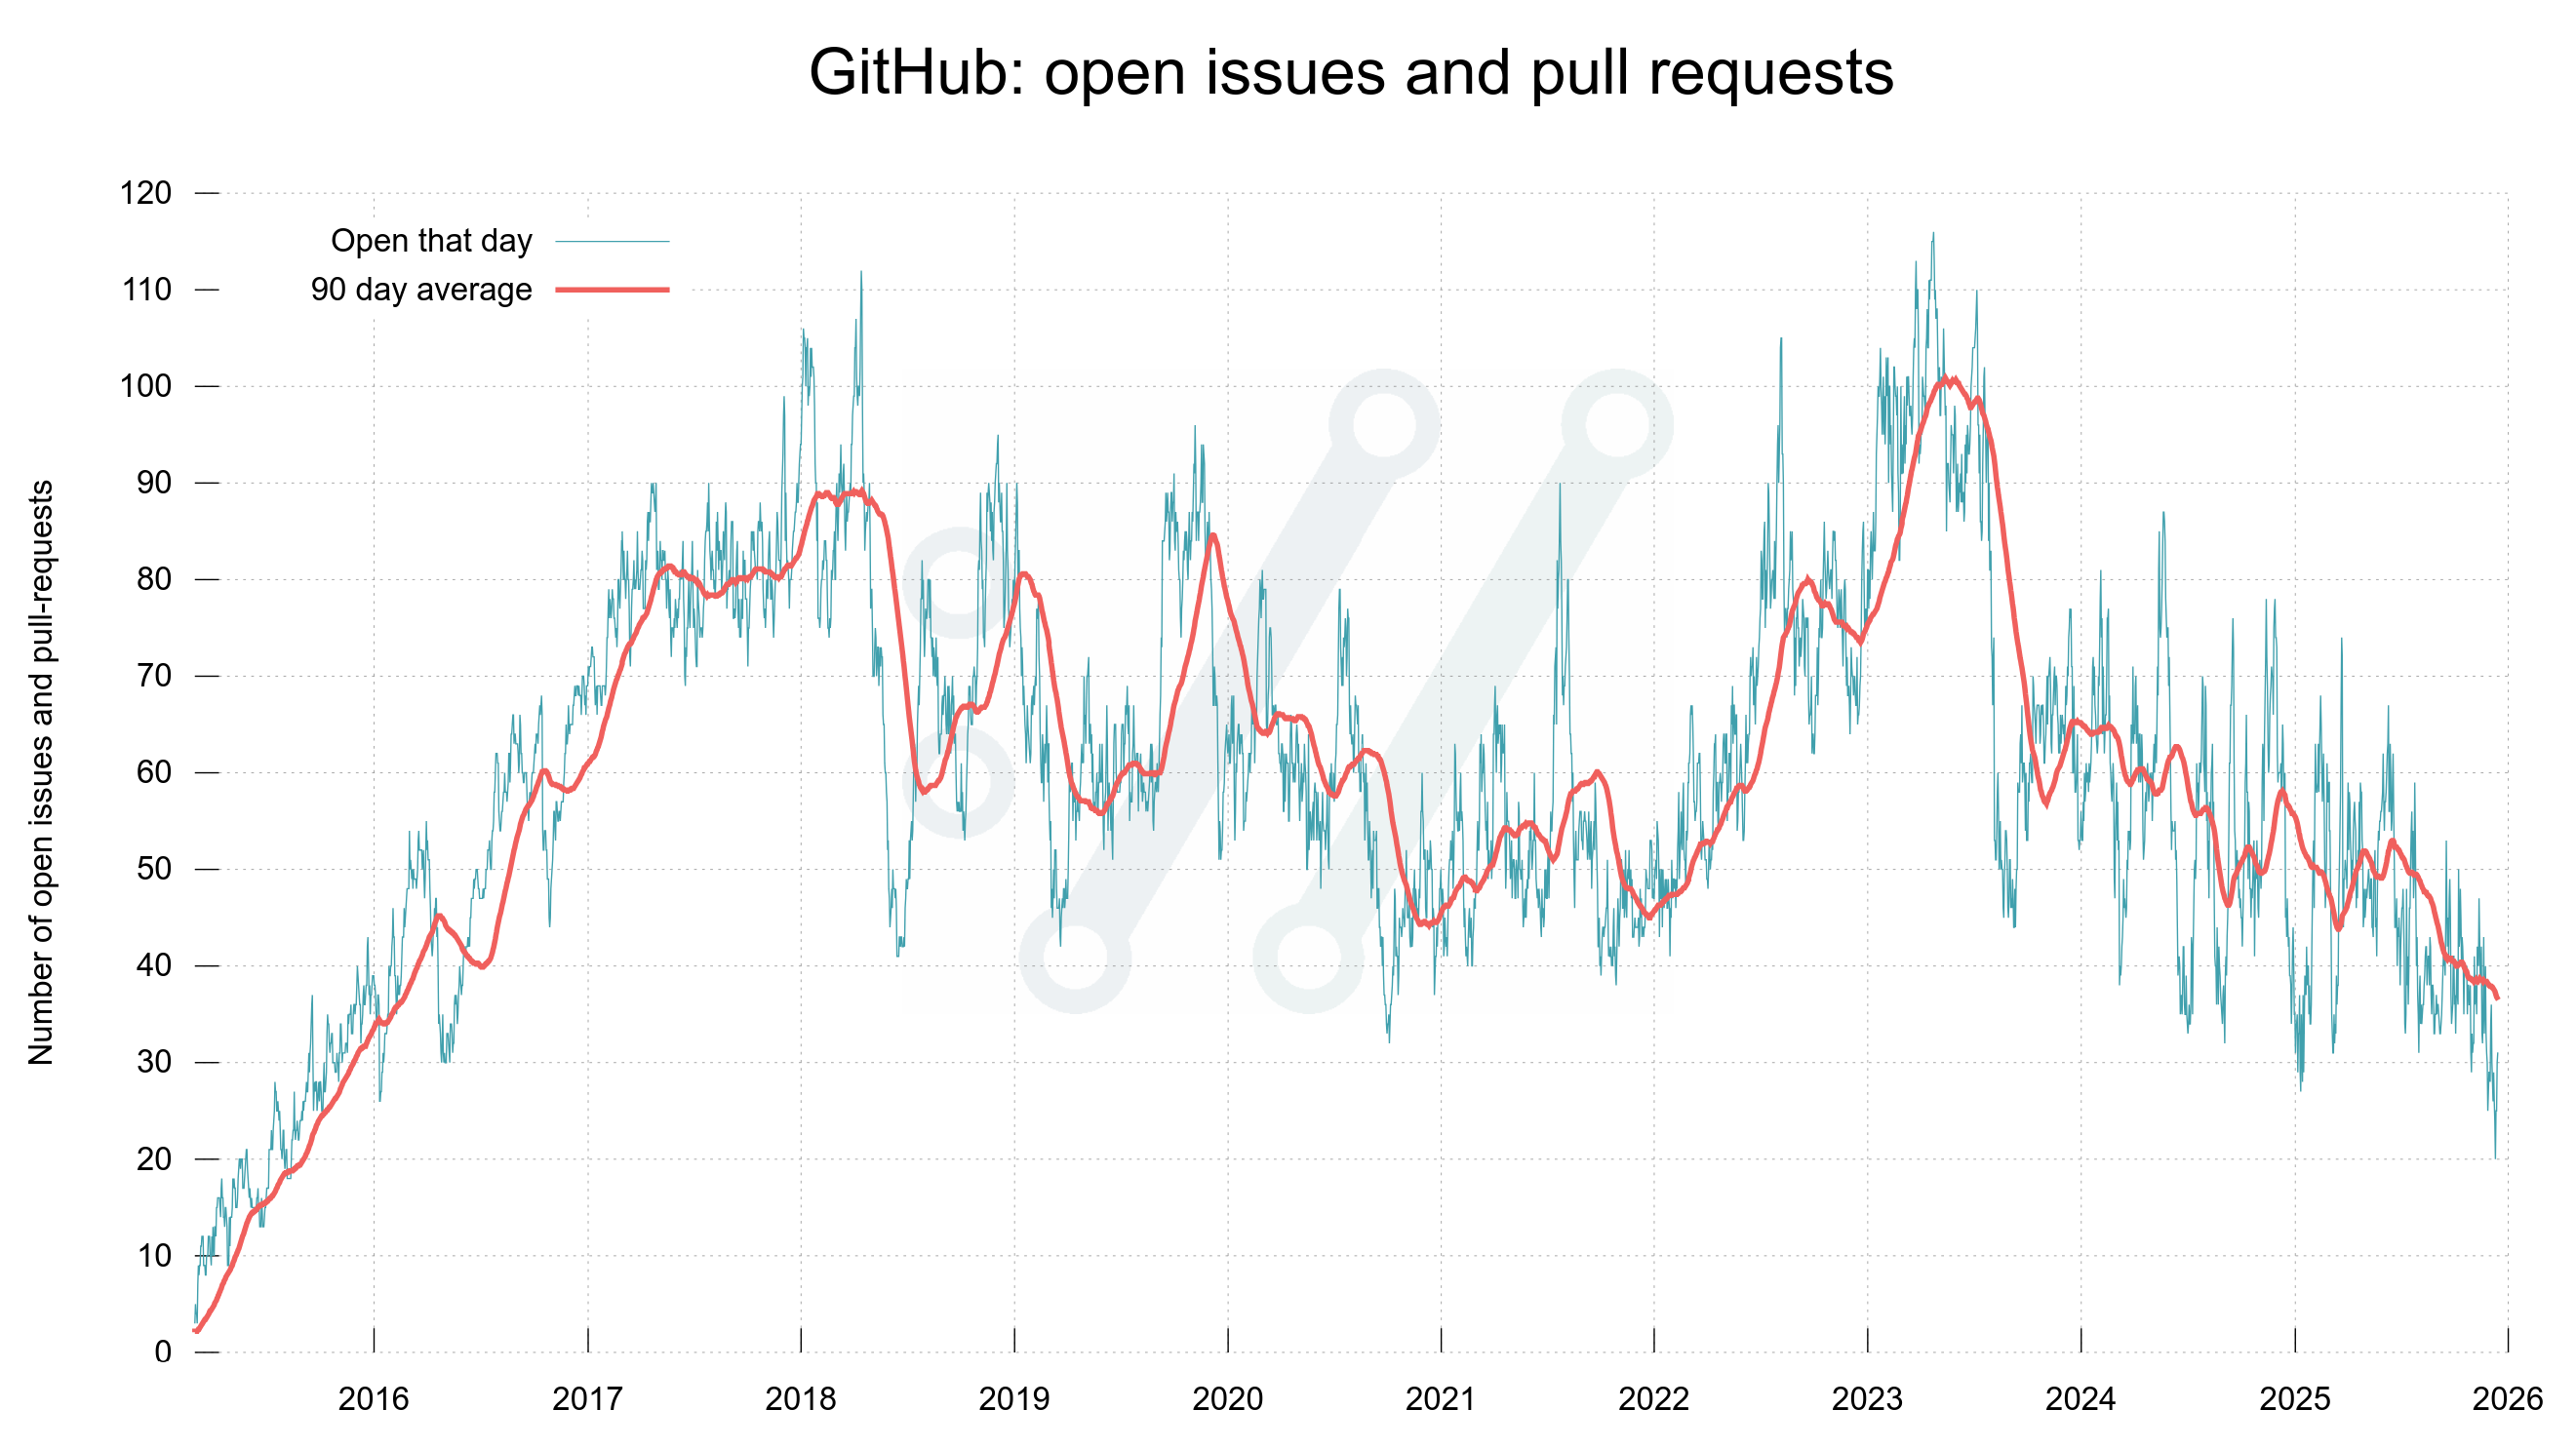
We work hard in the project to keep the number of open issues and pull requests low even when the frequency rises.
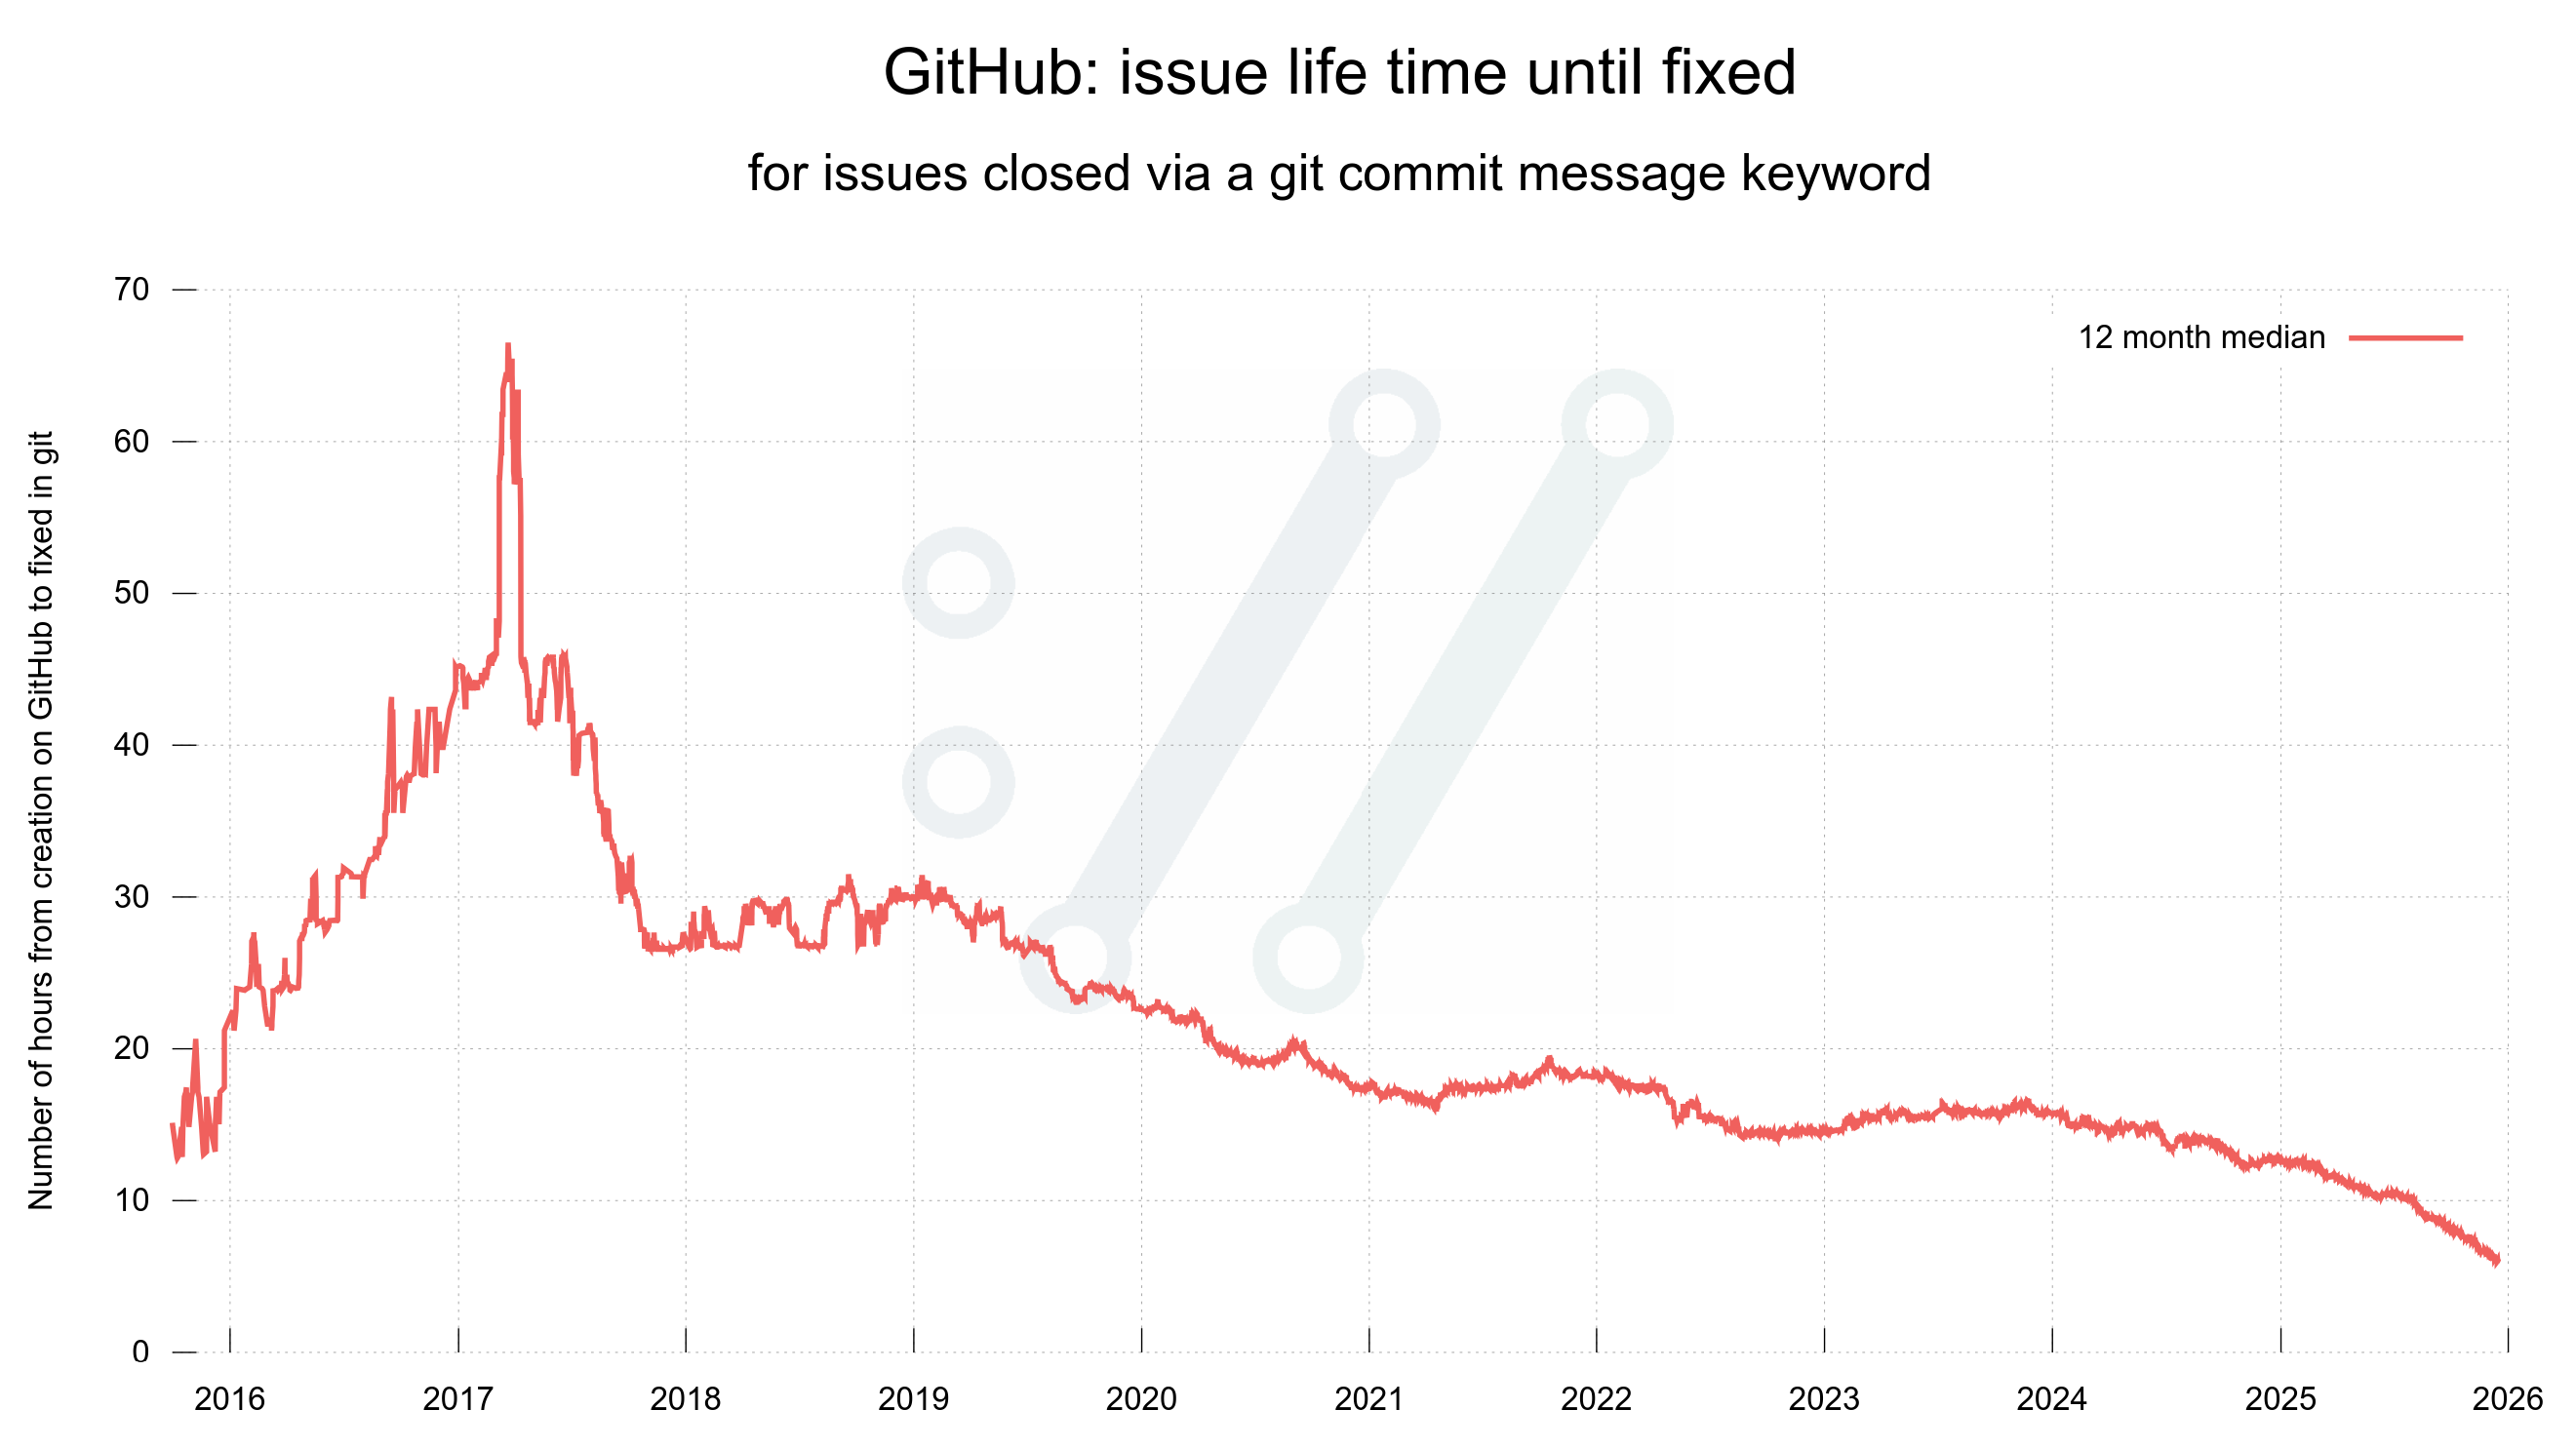
It can also be noted that issues and pull requests are typically closed fast. Out of the ones that are closed with instructions in the git commit message, the trend looks like below. Half of them are closed within 6 hours.
Of course, these graphs are updated daily and shown on the curl dashboard.
Note: we have not seen the AI slop tsunami in the issues and pull requests as we do on Hackerone. This growth is entirely human made and benign.