
The results are in. The curl user survey 2017 was up for a little over two weeks and attracted answers from a total of 513 individuals. This was a much better turnout that last year’s disappointment – thank you everyone!
The 2017 survey analysis as a 40 page PDF
This year we learned that the distribution curve for the amount of protocols people use curl for looks like this:

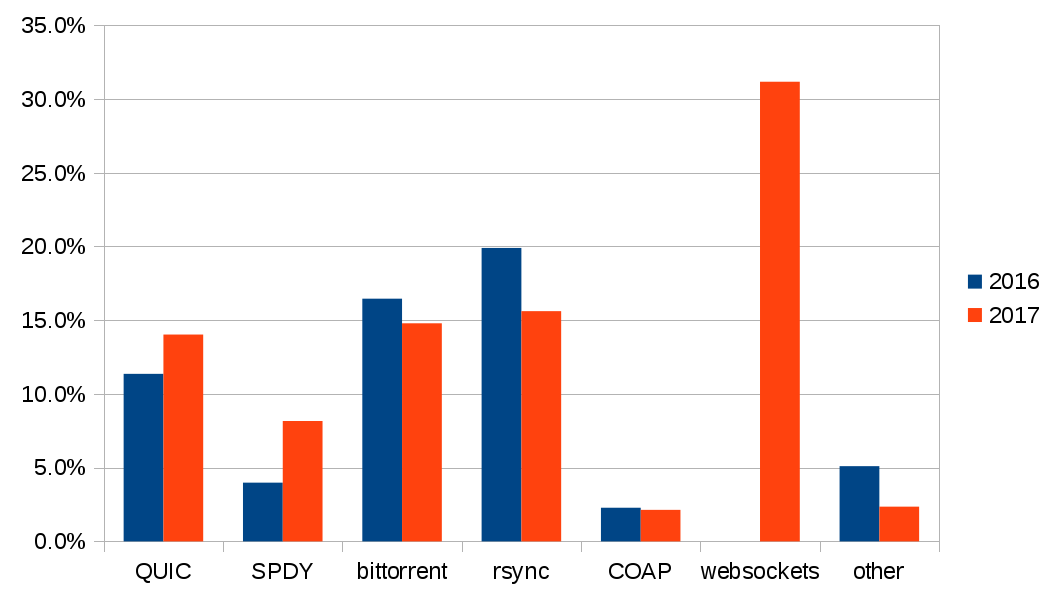
And the interest in getting even more protocols supported is still high, if not even very high and I think the top-most requested protocol is a bit surprising:
The outcome of the survey is the analysis document in which I’ve summarized by thoughts and added a bunch of graphs and other diagrams that illustrate the numbers. In particular compared to previous’ years results. It became a 40 page thing as I’ve tried to be detailed and also somewhat elaborate on commenting and reacting to a lot of the write-in suggestions and comments!
If you want to draw your own conclusions or just verify mine, I also offer you the following source material:
- The pristine 2017 CSV file as downloaded from Google, with all the results from the survey.
- To compare with last year, I also offer you the 2016 CSV file.
- During my the work of producing the analysis document, I imported the 2017 CSV file into libreoffice and fiddled with a lot of numbers and graphs, most of that didn’t end up in the document but you can find the raw 2017 survey libreoffice calc file and verify the outcomes or the formulas used.