
tldr: the live version is here: https://curl.se/perf/
How fast is “fast” and is it good enough? Does it run as fast now as it did before or was there a regression? What exactly needs to be fast? How fast is it?
These are questions that many projects and products face, and in curl we are no different. Yet, performance testing and comparisons are hard and full of landmines and time-wasting efforts. For many years we have occasionally brought up the idea of a performance test suite for curl only to shut it down again because the challenges seemed hard and no one was volunteering to do this.
This week it changed.
Let’s do this
I started out trying to find existing projects that host performance results for Open Source projects so that we could just feed our results something else and get great visualizations and data management. I did not find any such.
I then took a look at what existing tools there are for this purpose, and most pointers seemed to suggest that Grafana is a popular and maybe even a good solution to build something like this with. But man, that is a complicated machine and it felt more than a little overwhelming just figure out where or how to start with it. I decided to postpone that take as well.
Let me do this
I decided that instead of trying to do this the best and optimal way – I shouldn’t let perfect be the enemy of good – I would start out by doing the things I know how to do and take it as far as I can one step at a time. Something should be better than nothing.
Performance testing needs decently stable system conditions so that repeated runs produce reasonably similar results, when all involved factors remain identical. This is basically impossibly to accomplish using most cloud infrastructure since those are almost always shared with countless other users. At least on the cheap and free tiers we use.
We probably need our own dedicated hardware for this, but instead of trying to figure out where to get that and arrange for that, I would start by running performance tests on my own local development machine. I am a single user on this and it has many cores and runs decently fast. It should be good enough to get this going on.
I created a first shell script that updates the curl source code from git, it configures and builds it. Then it runs a bunch of tests, outputs a bunch of data and logs all the output in a single log file. I started out with a few simple tests. How fast does curl download a 100 GB file from localhost, how many allocations and how big allocations does it need for a single HTTP download?
My second script parses all the test log files from the previous builds and generates summaries and graphs for them. To make it possible for humans to see how the performance changes between builds and ideally to automatically detect when something changes more than what should be tolerated.
As I am a graph addict already since before, and that journey has taught me a little gnuplot, I decided that even while there probably are much better tools and fancy JavaScript things that could be used, I don’t know them and learning them now is an endeavor I rather avoid. So I stick to what I know and can get results with quickly.
A third script is invoked from a crontab every twenty minutes, sets up some variables and invokes the runner script.
Once the basics started to work, I showed my curl friends the early versions and I soon created a new git repository for the code.
It’s live baby
After a little more poking, I soon made my locally produced performance test summary get packaged and automatically transferred to the curl website after each build, and voila, the first public curl performance tests were live and public.
Getting this data available immediate triggered curl developers. It only took hours until we had the first proposed changes to improve some numbers, and soon we had a few merges to that affect. Visibility really helps!
The performance numbers we get are still varying to a certain degree, partially of course because I still use my machine for my daily development things, but also because most of them do real (localhost) networking and that is by its nature a little… varying.
The system builds and runs a new round every twenty minutes and it does that using the latest commits from git. This setup makes it sometimes run many rounds on the same commit and it might also mean that it sometimes updates and get several new commits at once, so it might skip a round for some commits. I might reconsider this design later, but since it is still a twenty minute time window, the number of commits is still limited.
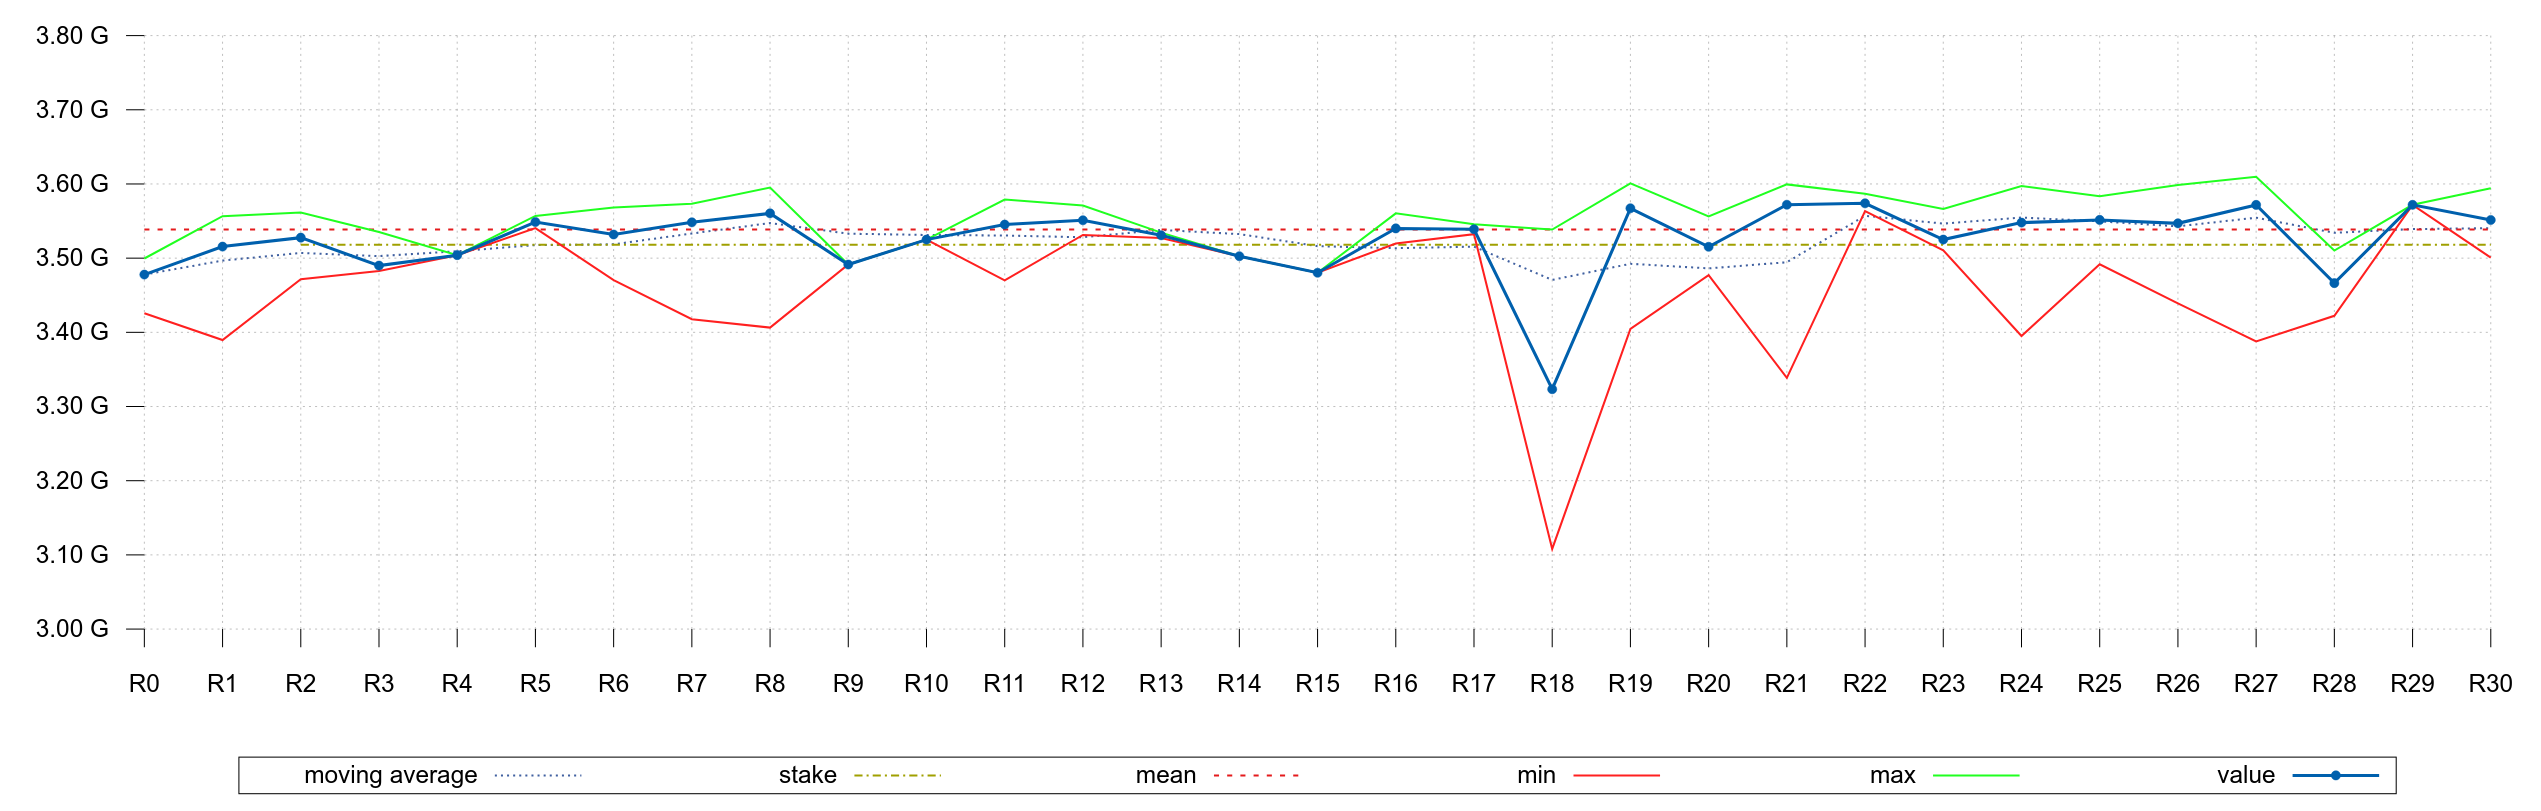
When the script makes multiple build rounds on the same commit, it accumulates the numbers and for the graph it stores the maximum, the median and the minimum value. It helps show the variation per commit and allows us to cram more into the graphs. It is still early days, but there will be a maximum limit to how many commits that can be displayed in a single graph and still be helpful.
Distribution
To help visualize the distribution and data spread per test, I created a separate illustration that shows the minimum, maximum, P25, P75, medium and mean values in a Box-and-Whisker Plot.

Changing conditions
An obvious downside with me just storing build logs in files, is that it will not scale up to the millions. I did however decide that I’m not designing this system for that. At least not now.
Performance tests are highly specific and dependent on the exact machine it runs on, the exact third party libraries and their versions that are used, the other components involved in the tests, such as the servers, and more.
I expect that we will change conditions for the tests every once in a while that makes it hard to compare the current numbers with past numbers. Therefore I think the performance test numbers and values are primarily useful in the short term. To help us spot if we land something that subtly and unintentionally degrades something.
Stakes
To detect extremely slow and long-term changes in performance and even making sure we can better survive wiping all the existing build logs etc, I introduced a concept I call stakes. As in a stake pole. A marker. An arbitrary threshold set manually for each specific test. This value can be used to measure performance test results against, now and later. As conditions change and maybe something makes the results go up or down and we are fine with those changes because they are motivated and expected, then we just change the stakes.
If it works out, I might try to have the system automatically detect and maybe highlight tests that deviate too much from its set stake (at least if done in the wrong direction) . It could be a signal that something bad was merged.
Balances
As with everything in life, things are often balanced out. We already ran into this when we eagerly merged several changes to reduce the number of allocations done for a single HTTP download, only to realize that one of the optimizations we did had the side-effect that it expanded the size one of the main structs maybe a little too much…
Improvements in one area might come at an expense in another. With sufficient tests and data we can improve curl for users, and at the same time make sure that our changes don’t come with a cost we are not prepared to pay. Exactly how to make the balance is of course a question we need to deal with, discuss and decide. Possibly for every change we do!
The tests
As I write this, we have 24 tests and a full test round completes in about six minutes on my machine.
We can of course do multiple builds using different hardware, different operating systems, different build options, different third party libraries and different test servers to check more angles of performance, and I am certainly open for and prepared to do that going forward. I will however first let this single-flavor run for a while so that we get more data, get a change to tweak it and make it as usable as possible for curl developers.
As with everything there is no end to what we can make this do. This is a start. I sure we can take it further as we move along. In particular if people join in and help out. Both with ideas and proposals for visualizations, graphs and new tests to add, but also with actual pull-requests and code.
Build volumes and graphs
Over the last year, we have merged, on average, about 10 commits per day. If we keep this pace up and this performance test setup can show 100 build rounds conveniently into a single graph, that is just ten days of development. Probably not enough.
Once we reach one hundred builds or so in the first graphs I need to consider adding separate long term graphs that use select data-points to display data development over a longer time. Some googling told me the Largest-Triangle-Three-Buckets, or LTTB for short, is a fine algorithm to use for this. I now do a separate “long term” graph that “downsamples” the full range down to something that can be shown in a reasonable way. I suppose we will see properly in the future how this works.
Spotting change
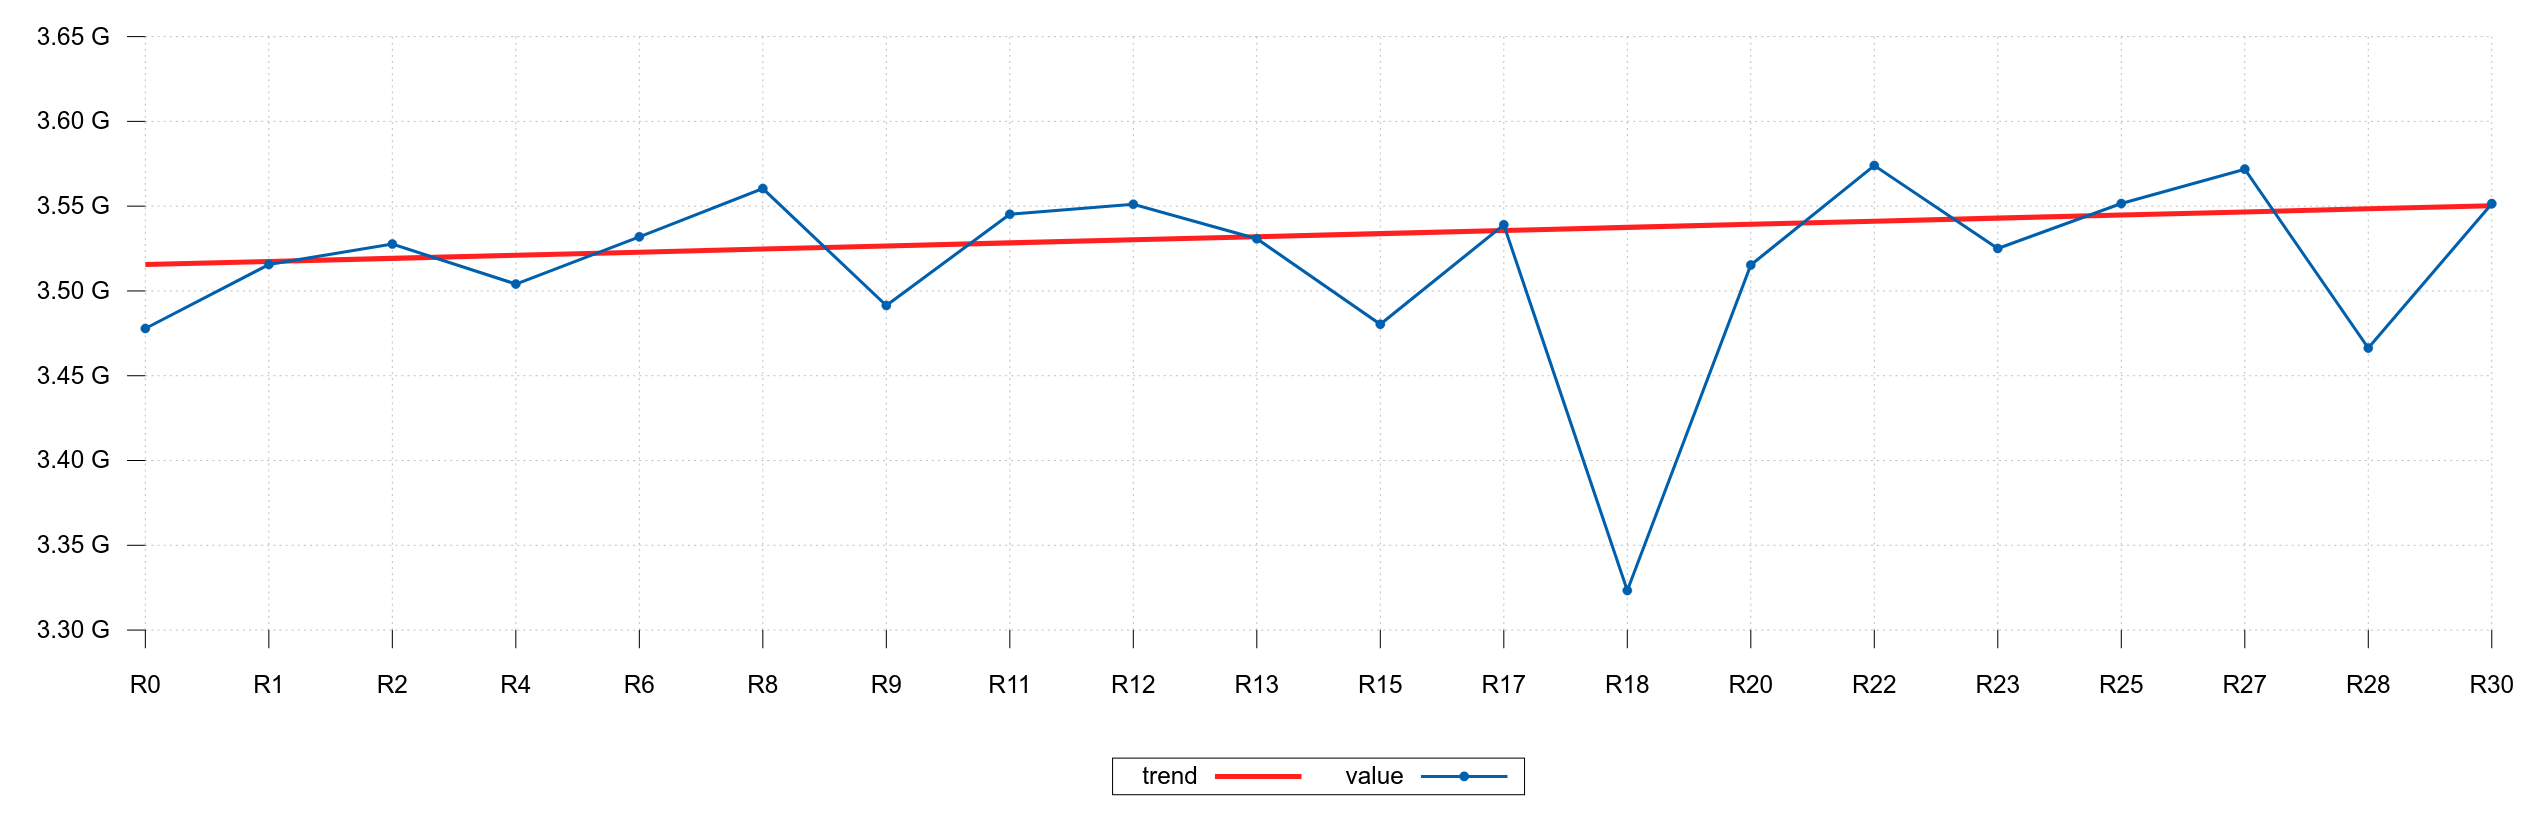
The stake thing I mentioned is one way to help us spot gradual performance changes over time. Another googling told me that there’s a Mann-Kendall Test + Sen’s Slope algorithm to use to identify trends in graphs like this and it can be used to plot a trend. It might work as a helper to better identify… yeah, the data trend for each test.
Developing
This setup has only existed for a few days. There is lots to do, lots to learn and much more to experiment with.
Your comments, help and pull-requests will be appreciated!
Omg I love this! I wish I had more time to dive into this, it definitely could provide a great basis for any performance measurements with curl. I hope this inspires other students to do some curl based performance measures.
Have you considered adding historical data, maybe just pot a few past releases?
For OpenBSD we created something similar for the network stack just after meltdown and the visible impact is astonishing.
http://bluhm.genua.de/perform/results/perform.html
Alexander Bluhm also gave a presentation on it at EuroBSDCon in 2019: https://www.youtube.com/watch?v=as5gCNgWjmY
This also taught me a lot of methodology for the QUIC measurements I presented at the last curl up.
And of course it is all gnuplot too.
For Bluhm I invested some time to do CSS hacks to toggle different measurements without JS, if you click on an individual graph you can see it:
http://bluhm.genua.de/perform/results/7.9/gnuplot/splice.html
The other inspiration was Stefan’s work with HTTP requests in curl, which you are well aware of:
https://github.com/icing/blog/blob/main/curl-h3-performance.md
PS: be careful about all the pitfalls with updating or changing anything on the measurement setup.
@Moritz: historic data is complicated since the current 3rd party libraries etc often don’t work with old curl releases etc, so it’s a lot of work for not so much gain I think. It is not my focus with this.
Most of the tests running in these performance tests right now are actually the ones Stefan Eissing has written and he has used as the basis for several of his past (and presumably coming) blog posts on curl performance.
Have you considered running these tests backwards? Like say grab a random commit every 15 days over the last couple years and graph that. Might be able go find regressions that were missing, or the general shape/slope of the curve prior to the introduction of these tests (which could prove a useful point of comparison for how these numbers evolve now that they are visible)
@Nick: the code is there, anyone is free (and should feel encouraged) to do that! I personally don’t have that focus for now and I’m not sure I would find it that terribly productive, even if of course it would be a great chance to render many new cool graphs…