more views on curl vulnerabilities

This is an intersection of two of my obsessions: graphs and vulnerability data for the curl project.

In order to track and follow every imaginable angle of development, progression and (possible) improvements in the curl project we track and log lots of metadata.

In order to educate and inform users about past vulnerabilities, but also as a means for the project team to find patterns and learn from past mistakes, we extract and document every detail.

Do we improve?

The grand question. Let’s get back to this a little later. Let’s first walk through some of the latest additions to the collection of graphs on the curl dashboard.

The here data is mostly based on the 167 published curl vulnerabilities to date.

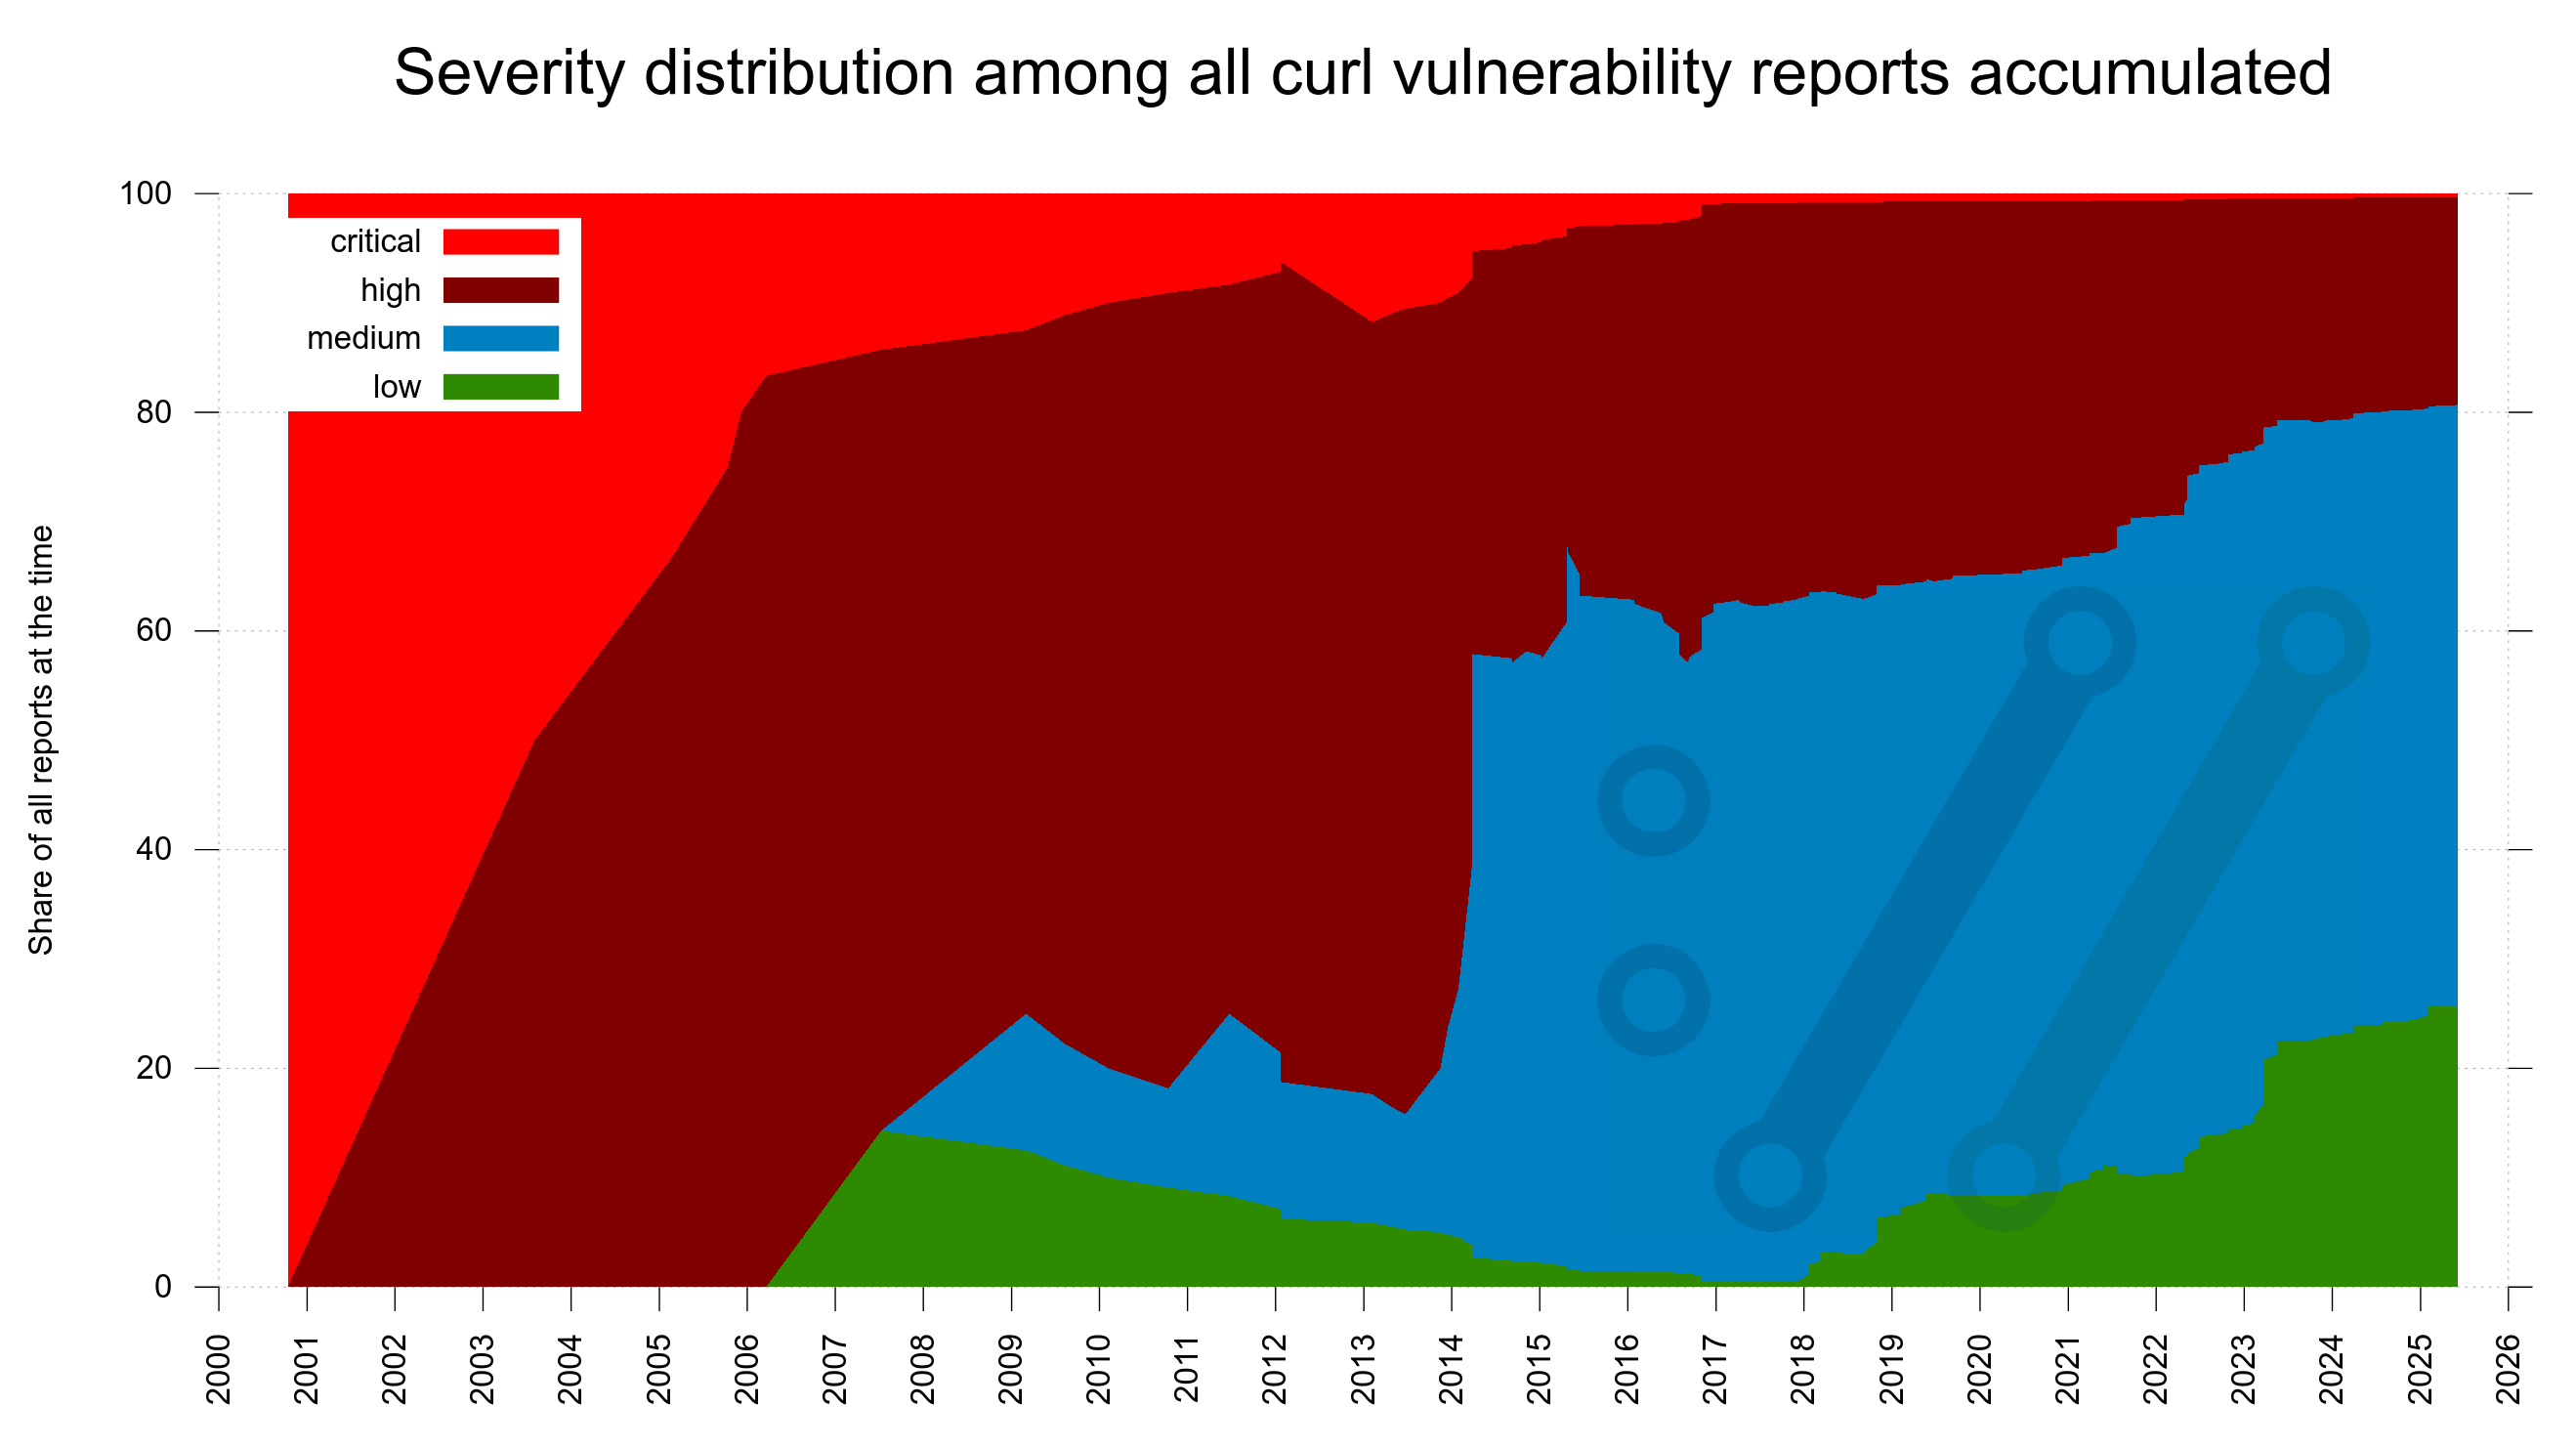
vulnerability severity distribution

Twenty years ago, we got very few vulnerability reports. The ones we got were only for the most serious problems and lots of the smaller problems were just silently fixed without being considered anything else than bugs.

Over time, security awareness has become more widespread and nowadays many more problems are reported. Because people are more vigilant, more people are looking and problems are now more often considered security problems. In recent years also because we offer monetary rewards.

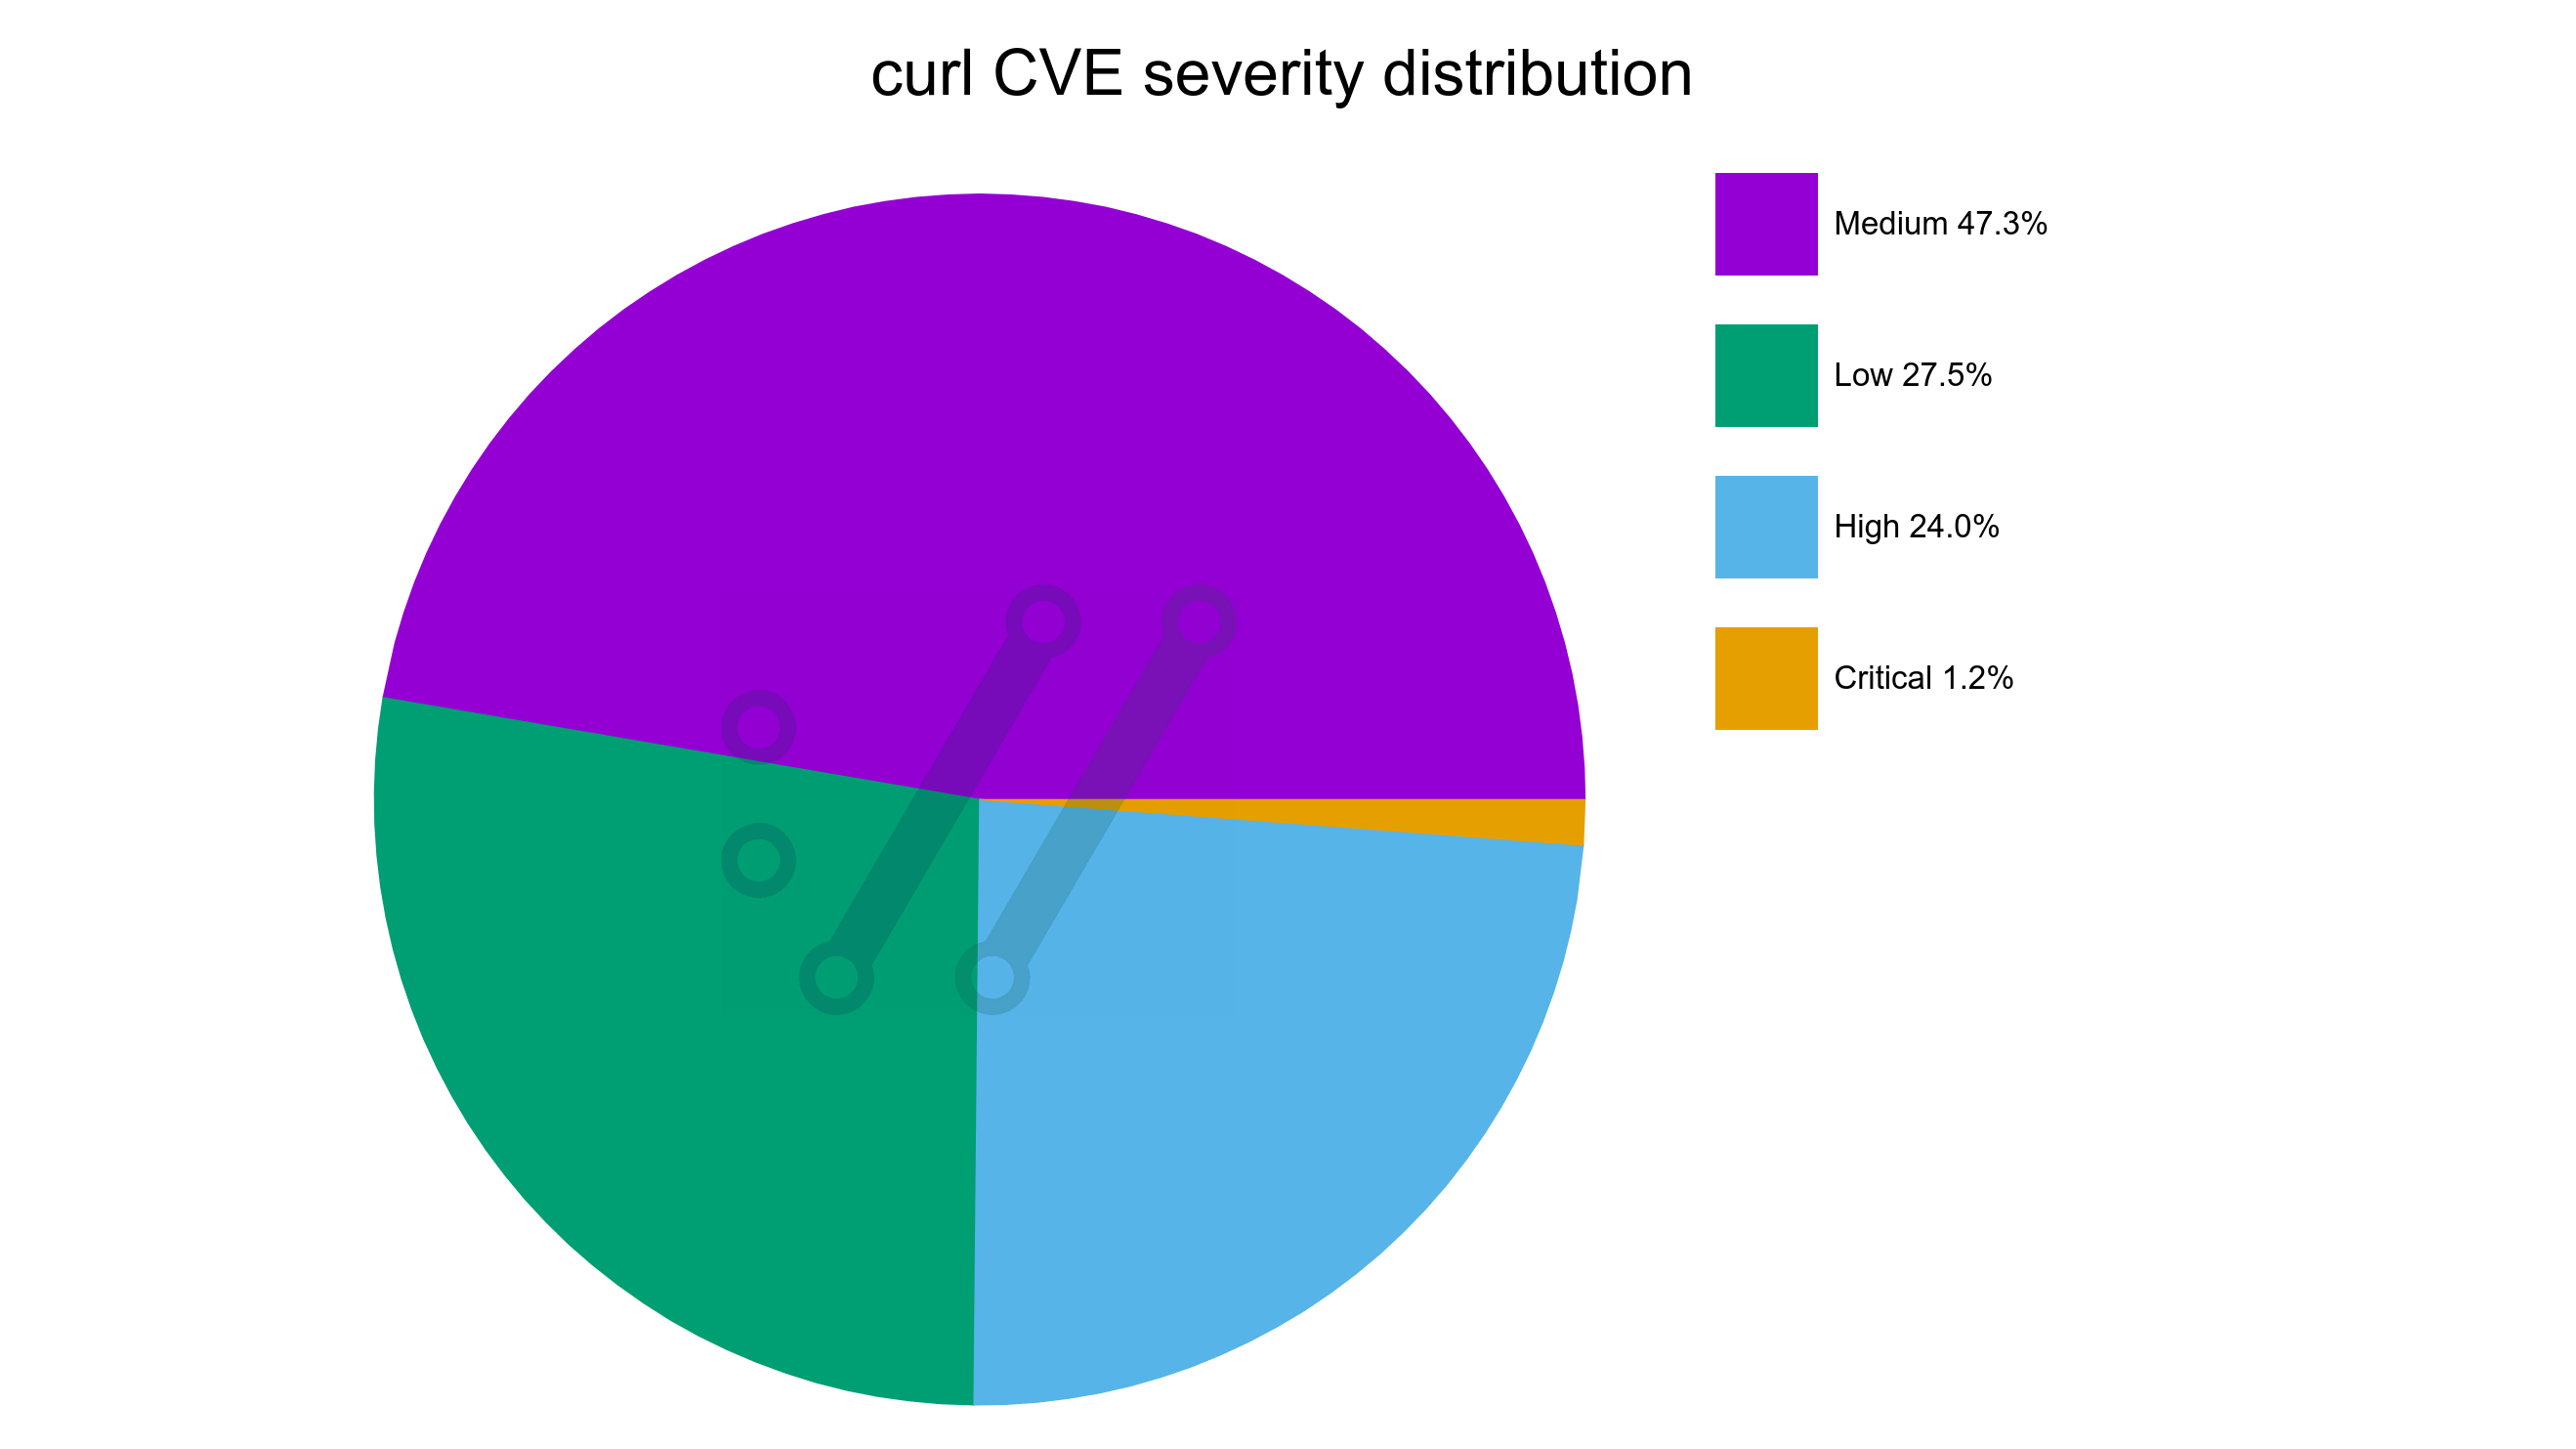
This development is clearly visible in this new graph showing the severity distribution among all confirmed curl vulnerabilities through time. It starts out with the first report being a critical one, adding only high severity ones for a few years until the first low appears in 2006. Today, we can see that almost half of all reports so far has been graded medium severity. The dates in the X-axis are when the reports were submitted to us.

Severity distribution in code

One of the tricky details with security reports is that they tend to identify a problem that has existed in code already for quite some time. For a really long time even in many cases. How long you may ask? I know I did.

I created a graph to illustrate this data already years ago, but it was a little quirky and hard to figure out. What you learn after a while trying to illustrate data over time as a graph, is sometimes you need to try a few different ways and layouts before it eventually “speaks” to you. This is one of those cases.

For every confirmed vulnerability report we receive, we backtrack and figure out exactly which the first release was that shipped the vulnerability. For the last decades we also identify the exact commit that brought it and of course the exact commit that fixed it. This way, we know the exact age of every vulnerability we ever had.

Hold on to something now, because here comes an information dense graph if there ever was one.

  • There is a dot in the graph for every known vulnerability
  • The X-axis is the date the vulnerability was fixed
  • The Y-axis is the number of years the flaw existed in code before we fixed it
  • The color of each dot indicates the severity level of the vulnerability (see the legend)

To guide the viewer, there is also a few diagonal lines. They show the release dates of a number of curl versions. I’ll explain below how they help.

Now, look at the graph here and I’ll continue below.

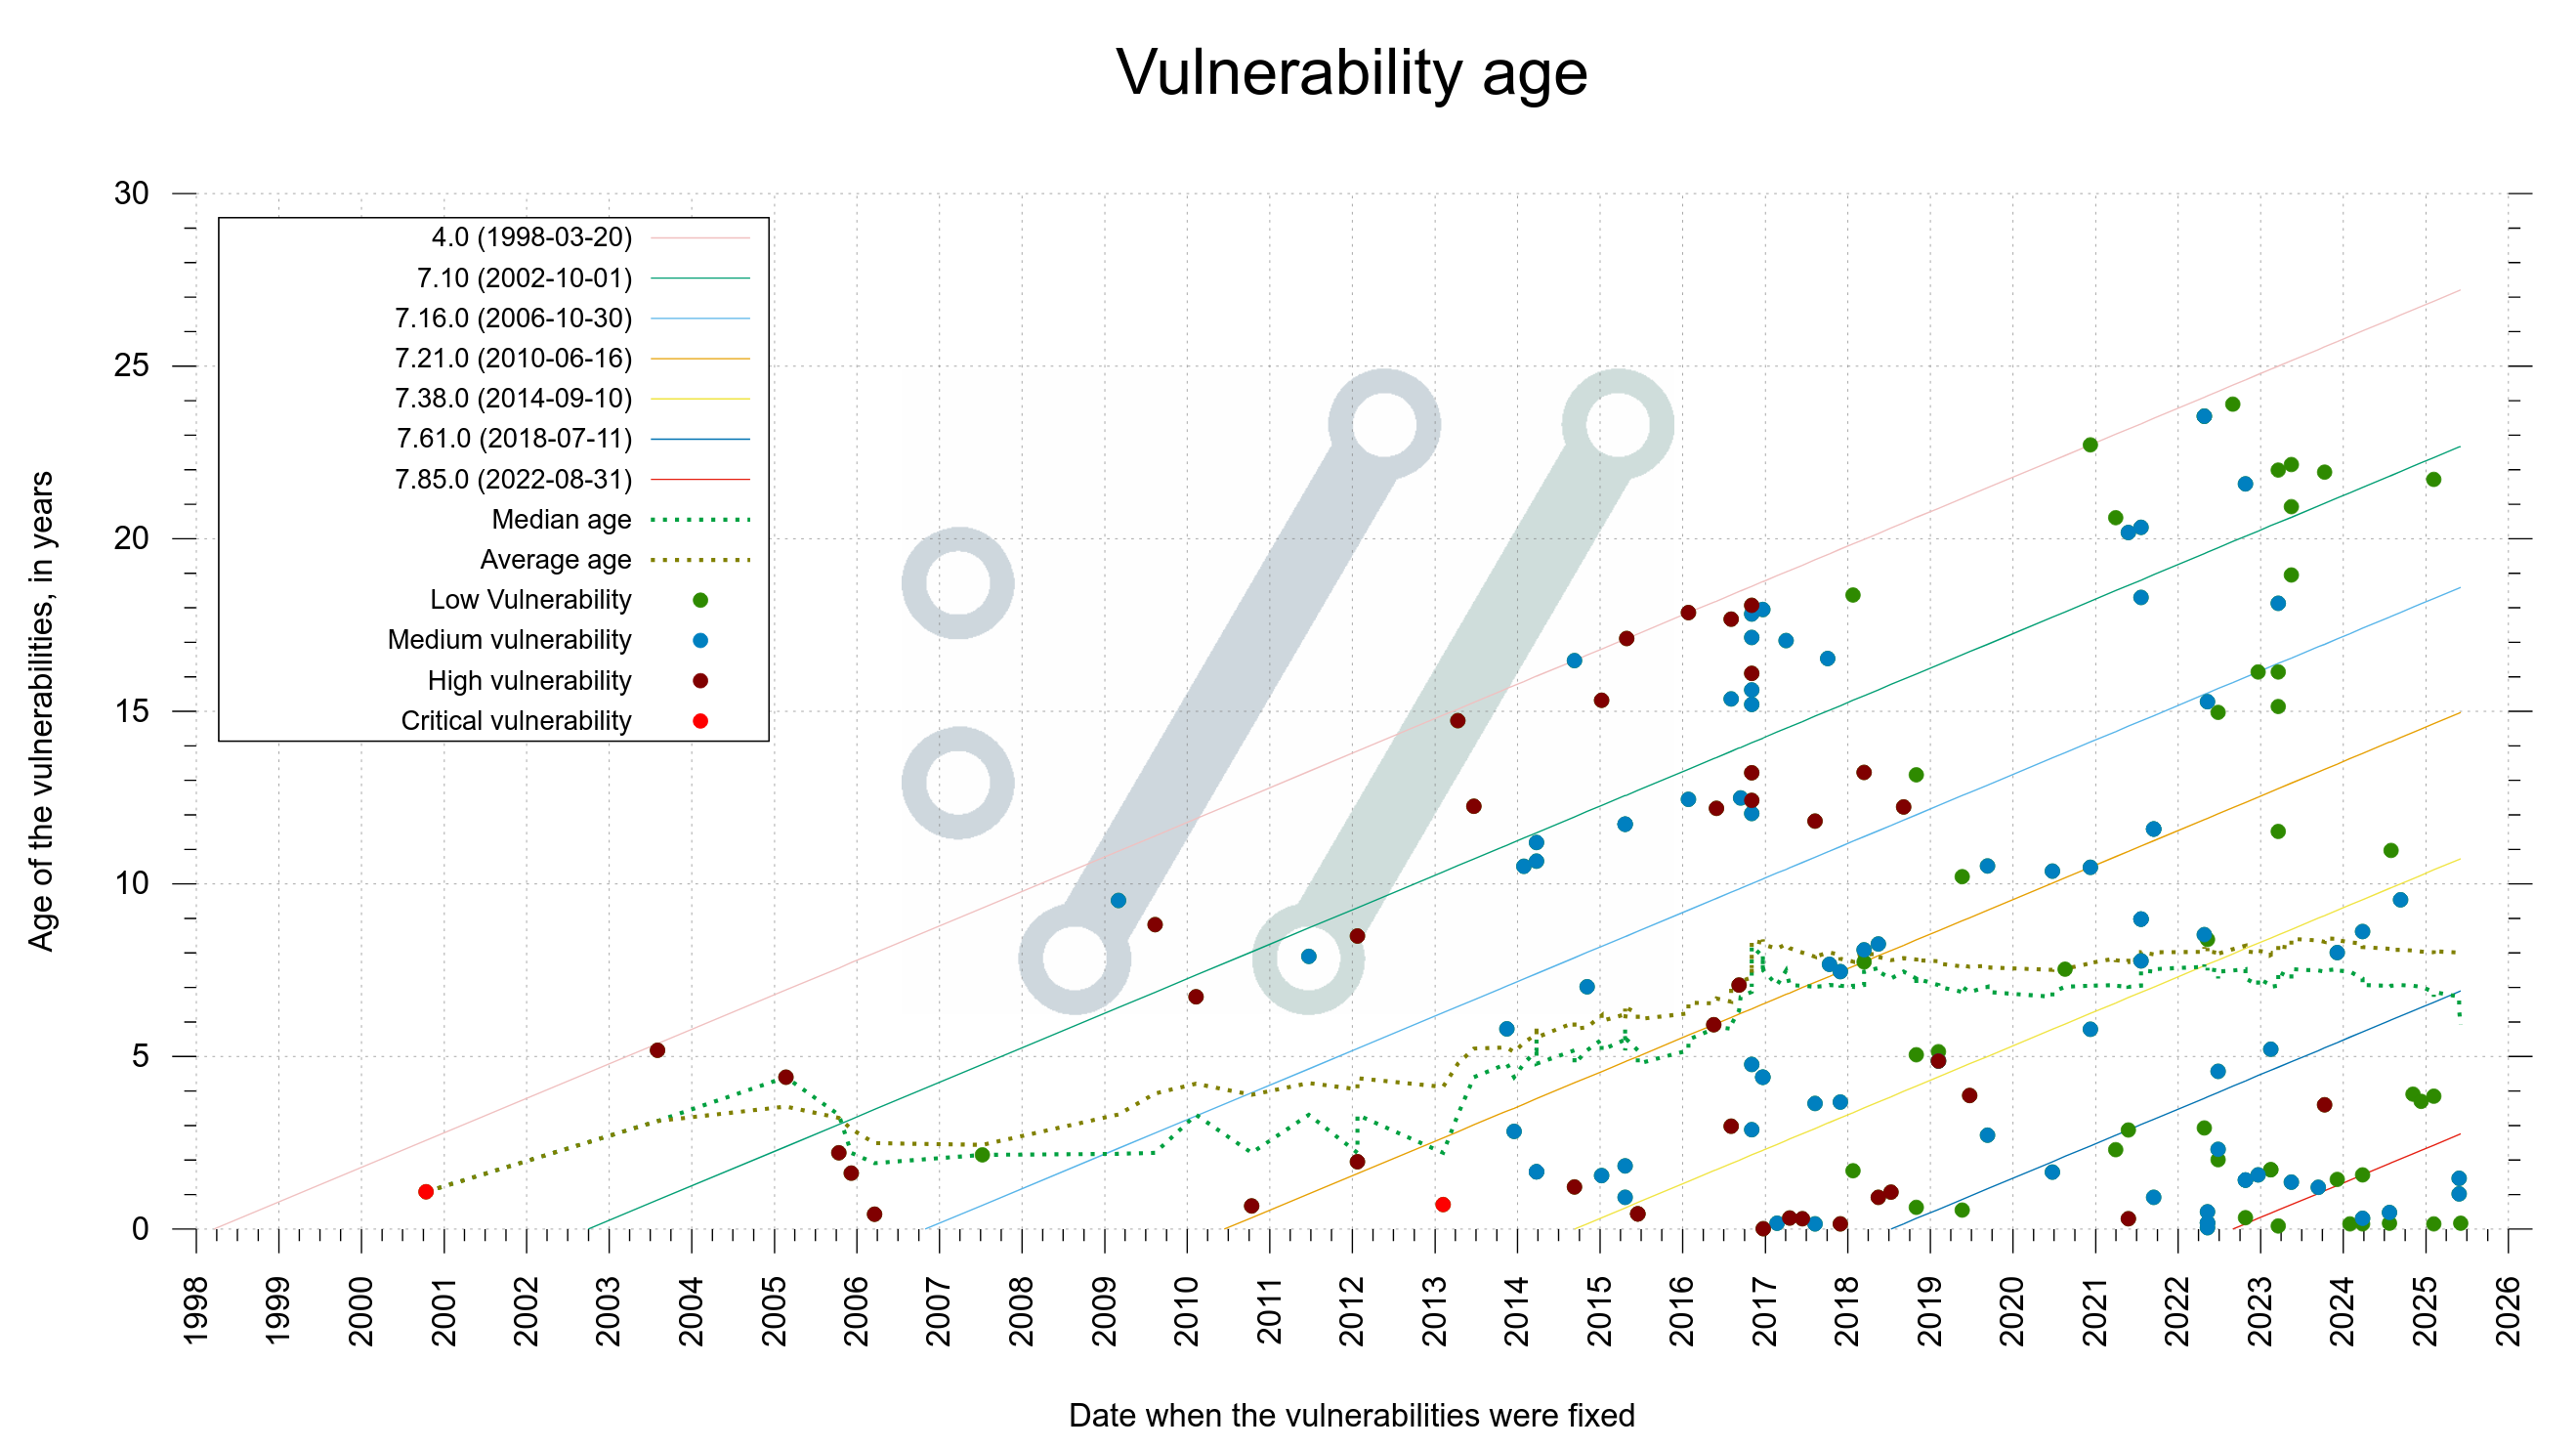
Yes, you are reading it right. If you count the dots above the twenty year line, you realize that no less than twelve of the flaws existed in code that long before found and fixed. Above the fifteen year line is almost too many to even count.

If you check how many dots that are close to the the “4.0” diagonal line, it shows how many bugs that have been found throughout the decades that were introduced in code not long after the initial curl release. The other diagonal lines help us see around which particular versions other bugs were introduced.

The green dotted median line we see bouncing around is drawn where there are exactly as many older reports as there are newer. It has hovered around seven years for several recent years but has fallen down to about six recently. Probably too early to tell if this is indeed a long-term evolution or just a temporary blip.

The average age is even higher, about eight years.

You can spot a cluster of fixed issues in 2016. It remains the year with most number of vulnerabilities reported and fixed in curl: 24. Partly because of a security audit.

A key take-away here is that vulnerabilities linger a long time before found. It means that whatever we change in code today, we cannot see the exact effect on vulnerability frequency until many years into the future. We can’t even know exactly how long time we need to tell for sure.

Current knowledge, applied to old data

The older the projects gets, the more we learn about mistakes we did in the past. The more we realize that some of the past releases were quite riddled with vulnerabilities. Something nobody knew back then.

For every release ever made from the first curl release in 1998 we increase a counter for every vulnerability we now know was present. Make it a different color depending on vulnerability severity.

If we lay all this out in a graph, it becomes an interesting “mountain range” style look. In the end of 2013, we shipped a release that contained no less than (what we now know were) 87 security problems.

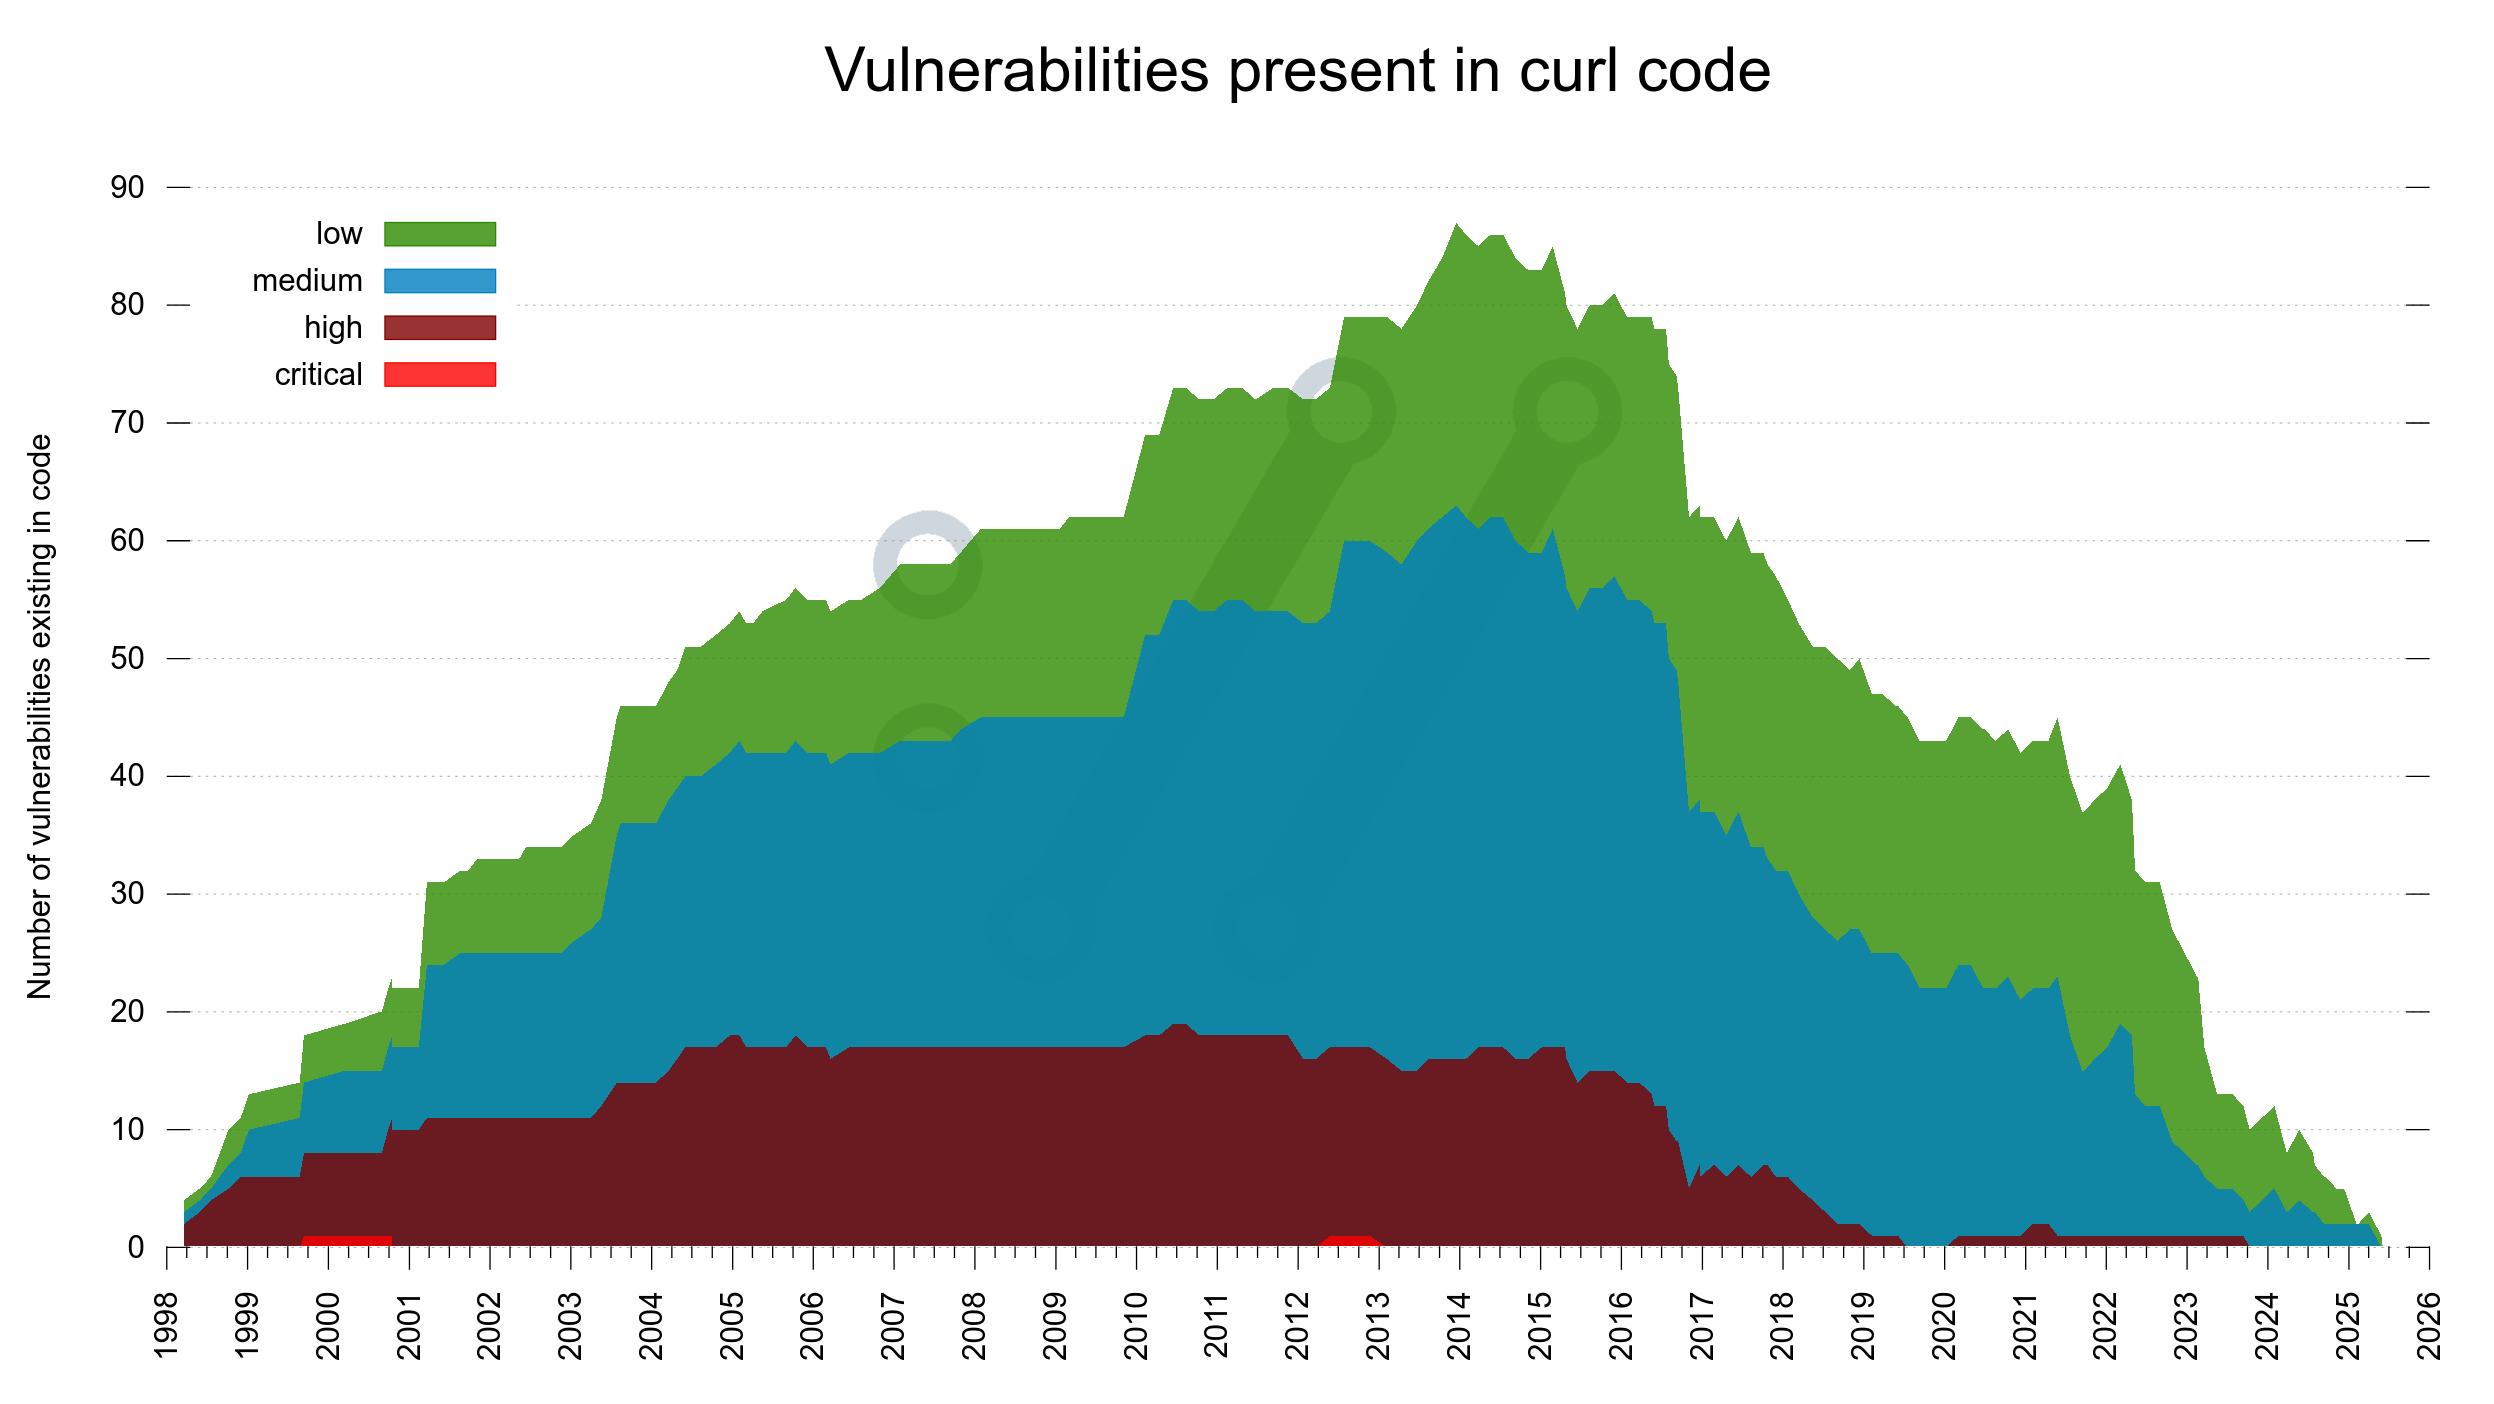
In this image we can spot that around 2017, the amount of high severity flaws present in the code decreased and they have been almost extinct since 2019. We also see how the two critical flaws thankfully only existed for brief periods.

However. Recalling that the median time for a vulnerability to exist before getting reported is six years, we know that there is a high probability that at least the rightmost 6-10 years of the graph is going to look differently when we redraw this same graph 6-10 years into the future. We simply don’t know how different it will be.

Did we do anything different in the project starting 2017? I have not been able to find any major distinct thing that stands out. We still only had a dozen CI builds but we started fuzzing curl that year. Maybe that is the change that is now visible?

C mistakes

curl is written in C and C is not a memory-safe language. People keep suggesting that we should rewrite it in other languages. In jest and for real. (Spoiler: we won’t rewrite it in any language.)

To get a feel for how much the language itself impacts our set of vulnerabilities, we analyze every flaw and assess if it is likely to have been avoided had we not used C. By manual review. This helps us satisfy our curiosity. Let me be clear that the mistakes are still ours and not because of the language. They are our mistakes that the language did not stop or prevent.

To also get a feel for how or if this mistake rate changes over time, I decided to use the same mountain layout as the previous graph: iterate over all releases and this time count the vulnerabilities they had and instead separate them only between C mistakes and not C mistakes. In the graph the amount of C mistakes is shown in a red-brown nuance.

C mistakes among the vulnerabilities present in code

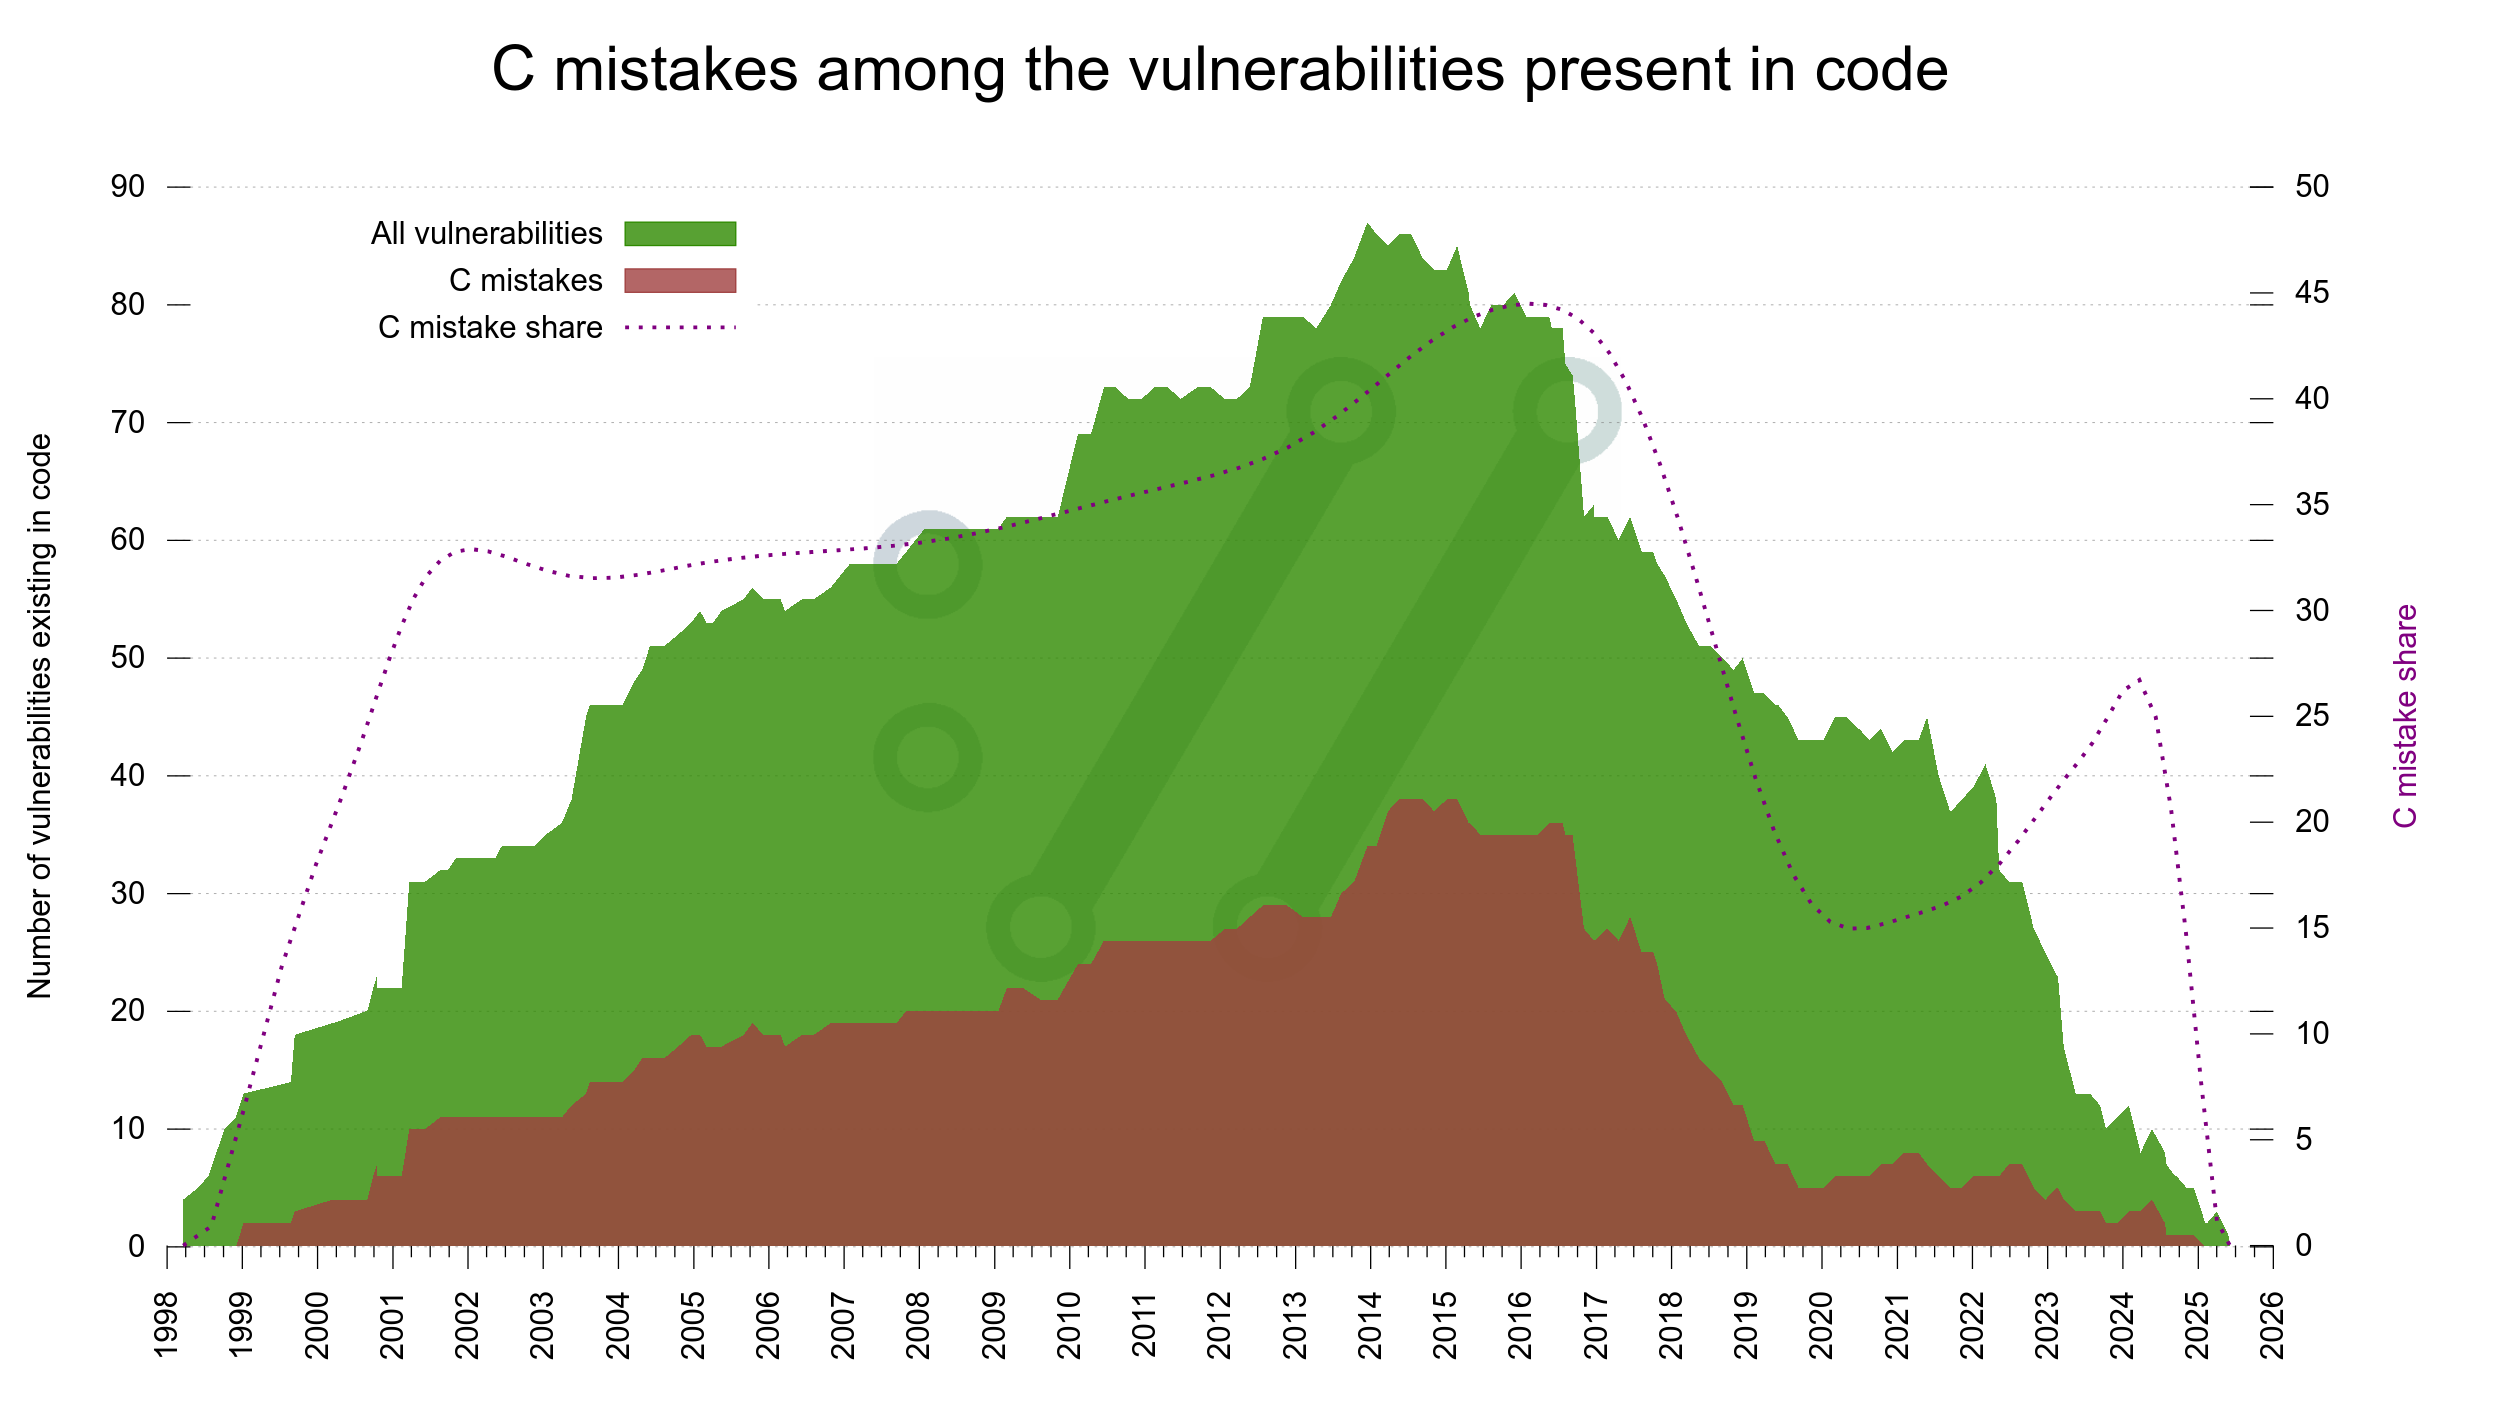
The dotted line shows the share of the total that is C mistakes, and the Y axis for that is on the right side.

Again, since it takes six years to get half of the reports, we must take at least the rightmost side of the graph as temporary as it will be changed going forward.

The trend looks like we are reducing the share of C bugs though. I don’t think there is anything that suggests that such bugs would be harder to detect than others (quite the opposite actually) so even if we know the graph will change, we can probably say with some certainty that the C mistake rate has indeed been reduced the last six seven years? (See also writing C for curl on how we work consciously on this.)

Do we improve?

I think (hope?) we are, even if the graphs are still not reliably showing this. We can come back here in 2030 or so and verify. It would be annoying if we weren’t.

We do much more testing than ever: more test cases, more CI jobs with more build combinations, using more and better analyzer tools. Combined with concerned efforts to make us write better code that helps us reduce mistakes.

keeping tabs on curl’s memory use

One of the harder things to look out for in a software project is slow or gradual decay over a long period of time. Like if we gradually make a library 1% slower or use 2% more memory every other month.

Sometimes it is totally acceptable to make code slower and use more memory because everything we do is a balance and sometimes we want new features or improved performance that might have to use more memory etc.

We don’t want the growth or slowing down to happen without it being an explicit decision and known trade-off. If we know what the trade-off is, we can reconsider and turn down a feature because we deem the cost too high. Or we accept it because the feature is useful.

In the curl project we make an concerned effort to keep memory use and allocations to a minimum and we are proud of our work. But we also continuously try to encourage and involve more contributors and it is easy to sometimes slip and do something in the code that maybe is not the wisest idea – memory wise.

Memory

In curl we have recently introduced a number of different checks to help us remain aware of the exact memory allocation and use situation.

An added complication for us is that curl builds and runs on numerous architectures, with lots of features on and off and with different sets of third party libraries. It means that internal struct sizes are rarely exactly the same on two different builds and code paths differ that may allocate data differently. We must make all memory limit checks with a certain amount of flexibility and margin.

Per test-case

We have introduced a system where we can specify exact limits for a single test case: this test may not do more than N allocations and it may not have more than Z bytes allocated concurrently.

We do this in debug-builds only where we have wrapper functions for all memory functions used in curl so doing this accounting is quite easy.

The idea is to set fairly strict memory limits in a number of selected typical test cases. We don’t use them in all test cases because when we in the future deem we want to allow increased memory use, it could easily become inconvenient and burdensome.

There is also default limits brought with this, so that tests that really need many allocations (more than 1,000) or unusually large amount of memory (more than 1MB concurrently) have to declare that in the test case or fail because of the suspicious behavior.

Primary struct sizes

A second size check was added in a new dedicated test case: it verifies that a number of important internal structs are sized within their allowed limits.

Keeping such struct sizes in check is important because we allocate a certain struct for each easy handle, each multi handle and for each concurrent connection etc. Because applications sometimes want to use a lot of those (from hundreds to several thousands), it is important that we keep them small.

This new test case makes sure that we don’t accidentally enlarge these structs and make users suffer. Maybe as a secondary effect, we can also use this test case and come back in ten years and see how much the sizes changed.

Memory allocated by others

While we work hard on reducing and keeping curl’s own memory use in check, curl also normally uses a number of third party libraries for fundamental parts of its operations: for TLS, compression and more. The memory monitoring and checks I write about in this post are however explicitly designed and intended to not check or include memory allocated and used by such third parties because we cannot easily affect them. It is up to every such library’s dev team to work on their code towards their own goals that may not be the same as ours.

This is of course frustrating at the same time. Downloading https://curl.se/ using the curl tool uses around 134 allocations done from curl and libcurl code. If curl is built with OpenSSL 3.5.0, the total amount of allocations such a command perform is over 54,000. Down from OpenSSL 3.4.1 which used over 200K!

Different TLS libraries clearly have totally different characteristics here. Rustls for example performed the same simple use case needing just 2,176 allocations and a much smaller peak usage at the same time.

My friends working on wolfSSL have several different configure options to tweak and optimize the malloc patterns. The full build I tested with used more allocations than OpenSSL 3.5.0 but less than half the peak amount.

Still worth it

I am a strong believer in each project making their best and keeping their own backyard clean and tidy.

Sure, curl does less than 0.3% of the allocations by itself when downloading https://curl.se using the latest OpenSSL version for TLS. This is still not a reason for us to be sloppy or to lower our guard rails. Instead I hope that we can lead by example.

This is what makes us proud as engineers and it makes our users trust us and appreciate what we ship.

People can use other TLS libraries. TLS library developers can improve their allocation patterns. And perhaps most importantly: in many cases the number of allocations or amount of used memory do not matter much.

Transfer speed checks next?

We want to add similar checks and verification for transfer speeds but that is an entirely different challenge and something that is being worked on separately from these changes.

Credits

Top image by LoggaWiggler from Pixabay

curl user survey 2025 analysis

I’m pleased to announce that once again I have collected the results, generated the graphs and pondered over conclusions to make after the annual curl user survey.

Get the curl user survey 2025 analysis here

Take-aways

I don’t think I spoil it too much if I say that there aren’t too many drastic news in this edition. I summed up ten key findings from it, but they are all more or less expected:

  1. Linux is the primary curl platform
  2. HTTPS and HTTP remain the most used protocols
  3. Windows 11 is the most used Windows version people run curl on
  4. 32 bit x86 is used by just 7% of the users running curl on Windows
  5. all supported protocols are used by at least some users
  6. OpenSSL remain the most used TLS backend
  7. libssh2 is the most used SSH backend
  8. 85% of respondents scored curl 5 out of 5 for “security handling”
  9. Mastodon is a popular communication channel, and is wanted more
  10. The median used curl version is just one version away from the latest

On the process

Knowing that it is quite a bit of work, it took me a while just to get started this time – but when I finally did I decided to go about it a little different this year.

This time, the twelfth time I faced this task, I converted the job into a programming challenge. I took it upon me to generate all graphs with gnuplot and write the entire document using markdown (and write suitable glue code for everything necessary in between). This way, it should be easier to reuse large portions of the logic and framework for future years and it also helped me generate all the graphs in more consistent and streamlined way.

The final report could then eventually be rendered into single page HTML and PDF versions with pandoc; using 100% Open Source and completely avoiding the use of any word processor or similar. Pretty nice.

As a bonus, this document format makes it super flexible and easy should we need to correct any mistakes and generate updated follow-up versions etc in a very clean way. Just like any other release.

Get the curl user survey 2025 analysis here

A website section

It also struck me that we never actually created a single good place on the curl website for the survey. I thus created such a section on the site and made sure it features links to all the previous survey reports I have created over the years.

That new website section is what this blog post now points to for the 2025 analysis. Should thus also make it easier for any curious readers to find the old documents.

Get the curl user survey 2025 analysis here

Enjoy!