I’m a fan of static code analyzing. With the use of fancy scanner tools we can get detailed reports about source code mishaps and quite decently pinpoint what source code that is suspicious and may contain bugs. In the old days we used different lint versions but they were all annoying and very often just puked out far too many warnings and errors to be really useful.
Out of coincidence I ended up getting analyses done (by helpful volunteers) on the curl 7.26.0 source base with three different tools. An excellent opportunity for me to compare them all and to share the outcome and my insights of this with you, my friends. Perhaps I should add that the analyzed code base is 100% pure C89 compatible C code.
Some general observations
First out, each of the three tools detected several issues the other two didn’t spot. I would say this indicates that these tools still have a lot to improve and also that it actually is worth it to run multiple tools against the same source code for extra precaution.
Secondly, the libcurl source code has some known peculiarities that admittedly is hard for static analyzers to figure out and not alert with false positives. For example we have several macros that look like functions and on several platforms and build combinations they evaluate as nothing, which causes dead code to be generated. Another example is that we have several cases of vararg-style functions and these functions are documented to work in ways that the analyzers don’t always figure out (both clang-analyzer and Coverity show problems with these).
Thirdly, the same lesson we knew from the lint days is still true. Tools that generate too many false positives are really hard to work with since going through hundreds of issues that after analyses turn out to be nothing makes your eyes sore and your head hurt.
Fortify
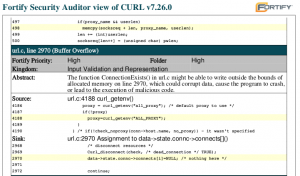
The first report I got was done with Fortify. I had heard about this commercial tool before but I had never seen any results from a run but now I did. The report I got was a PDF containing 629 pages listing 1924 possible issues among the 130,000 lines of code in the project.

Fortify claimed 843 possible buffer overflows. I quickly got bored trying to find even one that could lead to a problem. It turns out Fortify has a very short attention span and warns very easily on lots of places where a very quick glance by a human tells us there’s nothing to be worried about. Having hundreds and hundreds of these is really tedious and hard to work with.
If we’re kind we call them all false positives. But sometimes it is more than so, some of the alerts are plain bugs like when it warns on a buffer overflow on this line, warning that it may write beyond the buffer. All variables are ‘int’ and as we know sscanf() writes an integer to the passed in variable for each %d instance.
sscanf(ptr, "%d.%d.%d.%d", &int1, &int2, &int3, &int4);
I ended up finding and correcting two flaws detected with Fortify, both were cases where memory allocation failures weren’t handled properly.
LLVM, clang-analyzer
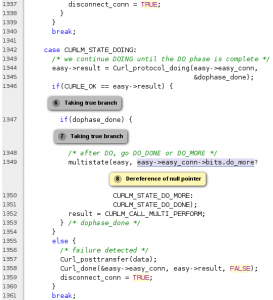
Given the exact same code base, clang-analyzer reported 62 potential issues. clang is an awesome and free tool. It really stands out in the way it clearly and very descriptive explains exactly how the code is executed and which code paths that are selected when it reaches the passage is thinks might be problematic.

The reports from clang-analyzer are in HTML and there’s a single file for each issue and it generates a nice looking source code with embedded comments about which flow that was followed all the way down to the problem. A little snippet from a genuine issue in the curl code is shown in the screenshot I include above.
Coverity
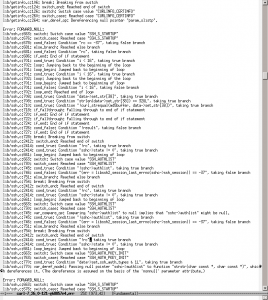
Given the exact same code base, Coverity detected and reported 118 issues. In this case I got the report from a friend as a text file, which I’m sure is just one output version. Similar to Fortify, this is a proprietary tool.

As you can see in the example screenshot, it does provide a rather fancy and descriptive analysis of the exact the code flow that leads to the problem it suggests exist in the code. The function referenced in this shot is a very large function with a state-machine featuring many states.
Out of the 118 issues, many of them were actually the same error but with different code paths leading to them. The report made me fix at least 4 accurate problems but they will probably silence over 20 warnings.
Coverity runs scans on open source code regularly, as I’ve mentioned before, including curl so I’ve appreciated their tool before as well.
Conclusion
From this test of a single source base, I rank them in this order:
- Coverity – very accurate reports and few false positives
- clang-analyzer – awesome reports, missed slightly too many issues and reported slightly too many false positives
- Fortify – the good parts drown in all those hundreds of false positives

