The curl project has its roots in the late 1996, but we haven’t kept track of all of the early code history. We imported our code to Sourceforge late 1999 and that’s how far back we can see in our current git repository. The exact date is “Wed Dec 29 14:20:26 UTC 1999”. So, almost 14 years of development.
Warning: this blog post contains more useless info and graphs than many mortals can handle. Be aware!
How much old code remain in the current source tree? Or perhaps put differently: how is the refresh rate of the code? We fix bugs, we change things, we add features. Surely we’ll slowly over time rewrite the old code and replace it with new more shiny and better working code? I decided to check this. Here’s what I found!
The tools
We have all code in git. ‘git blame’ is the primary tool I used as it lists all lines of all source code and tells us when it was added. I did some additional perl scripting around it.
The code
I decided to check all code in the src/ and lib/ directories in the curl and libcurl source tree. The source code is used to create both the curl tool and the libcurl library and back in 1999 there was no libcurl like today so we do get a slightly better coverage of history this way.
In total this sums up to some 112000 lines in the current .c and .h files.
To count the total amount of commits done to those specific files through history I ran:
git log --oneline src/*.[ch] lib/*.[ch] | wc -l
6047 commits in total. (if I don’t specify the files and count all commits in the repo it ends up at 16954)
git stats
We run gitstats on the curl repo every day so you can go there for some more and current stats. Right now it tells us that average number of commits is 4.7 per active day (that means days when actually something was committed), or 3.4 per all days over the entire time. There was git activity 3576 days in total. By 224 authors.
Surviving commits
How much of the code would you think still remains that were present already that December day 1999?
How much of the code in the current code base would you think was written the last few years?
Commit vs Author vs Date
I wanted to see how much old code that exists, or perhaps how the age of the code is represented in the current code base. I decided to therefore base my logic on the author time that git tracks. It is basically the time when the author of a change commits it to his/her local tree as then the change can be applied later on by a committer that can be someone else, but the author time remains the same. Sometimes a committer commits multiple patches at once, possibly at a much later time etc so I figured the author time would be a better time stamp. I also decided to track the date instead of just the commit hash so that I can sort the changes properly and also make interesting graphs that are based on that time. I use the time with a second precision so changes done a second apart will be recorded as two separate changes while two commits done with the same author time stamp will be counted as the same time.
I had my script run ‘git blame –line-porcelain’ for all files and had my script sum up all changes done on the same time.
Some totals
The code base contains changes written at 4147 different times. Converted to UTC times, they happened on 2076 unique days. On 167 unique months. That’s every month since the beginning.
We’re talking about 312 files.
Number of lines changed over time
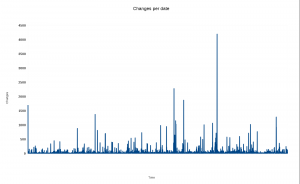
A graph with changes over time. The Y axis is number of lines that were changed on that particular time. (click for higher res)
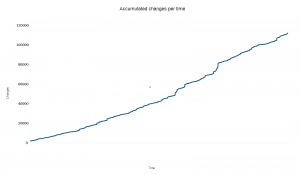
Ok you object, that doesn’t look very appealing. So here’s the same data but with all the changes accumulated over time.
Do you think the same as I do? Isn’t it strangely linear? It seems that the number of added lines that remain in the code today is virtually the same over time! But fair enough, the changes in the X axis are not distributed according to the time/date they represent so we shouldn’t be fooled by the time, but certainly we can see that changes in general only bring in a certain amount of surviving modified lines.
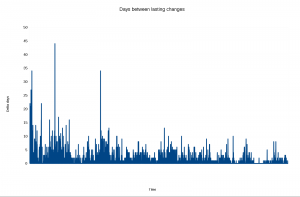
Another way to count the changes is then to check all the ~4000 change times of the present code, and see how many days between them there are:
Ah, now finally we’re seeing something. Older code that is still present clearly was made with longer periods in between the changes that have lasted. It makes perfect sense to me, since the many years of development probably have later overwritten a lot of code that was written in between.
Also, it is clearly that among the more recent changes that have survived they were often done on the same day or just a few days away from another lasting change.
Grouped on date ranges
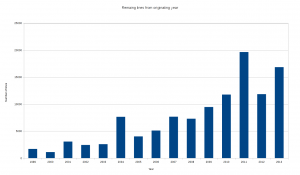
The number of modified lines split up on the individual year the change came in.
Interesting! The general trend is clear and not surprising. Two years stand out from the trend, 2004 and 2011. I have not yet investigated what particular larger changes that were made those years that have survived. The bump for 1999 is simply the original import and most of those lines are preprocessor lines like #ifdef and #include or just opening and closing braces { and }.
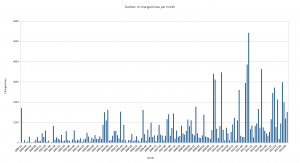
Splitting up the number of surviving lines on the specific year+month they were added:
This helps us analyze the previous chart. As we can see, the rather tall bars from 2004 and 2011 are actually several months wide and explains the bumps in the year-chart. Clearly we made some larger effort on those periods that were good enough to still remain in the code.
Correlate to added or removed lines?
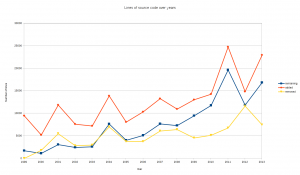
So, can we perhaps see if some years’ more activity in number of added or removed source lines can be tracked back to explain the number of surviving source code lines? I ran “git diff [hash1]..[hash2] –stat — lib/*.[ch] src/*.[ch]” for all years to get a summary of number of added and removed source code lines that year. I added those number to the table with surviving lines and then I made another graph:
Funnily enough, we see almost an exact correlation there for the first eight years and then the pattern breaks. From the year 2009 the number of removed lines went down but still the amount of surving lines went up quite a bit and then the graphs jump around a bit.
My interpretation of this graph is this boring: the amount of surviving code in absolute numbers is clearly correlating to the amount of added code. And that we removed more code yearly in the 2000-2003 period than what has survived.
But notice how the blue line is closing the gap to the orange/red one over time, which means that percentage wise there’s more surviving code in more recent code! How much?
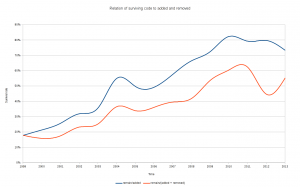
Here’s the amount of surviving lines/added lines and a second graph looking at surviving lines/(added + removed) to see if the mere source code activity would be a more suitable factor to compare against…
Code committed within the last 5 years are basically 75% left but then it goes downhill down to the 18% survival rate of the 1999 code import.
If you can think of other good info to dig out, let me know!

