 At curlup 2017 in Nuremberg, I did a keynote and talked a little about the road to what we are and where we are right now in the curl project. There will hopefully be a recording of this presentation made available soon, but I wanted to entertain you all by also presenting some of the graphs from that presentation in a blog format for easy access and to share the information.
Some stats and numbers from the curl project early 2017. Unless otherwise mentioned, this is based on the availability of data that we have. The git repository has data from December 1999 and we have detailed release information since version 6.0 (September 13, 1999).
Web traffic
First out, web site traffic to curl.haxx.se over the seven last full years that I have stats for. The switch to a HTTPS-only site happened in February 2016. The main explanation to the decrease in spent bandwidth in 2016 is us removing the HTML and PDF versions of all documentation from the release tarballs (October 2016).
My log analyze software also tries to identify “human” traffic so this graph should not include the very large amount of bots and automation that hits our site. In total we serve almost twice the amount of data to “bots” than to human. A large share of those download the cacert.pem file we host.
Since our switch to HTTPS we have a 301 redirect from the HTTP site, and we still suffer from a large number of user-agents hitting us over and over without seemingly following said redirect…
Number of lines in git
Since we also have documentation and related things this isn’t only lines of code. Plain and simply: lines added to files that we have in git, and how the number have increased over time.
There’s one notable dip and one climb and I think they both are related to how we have rearranged documentation and documentation formatting.

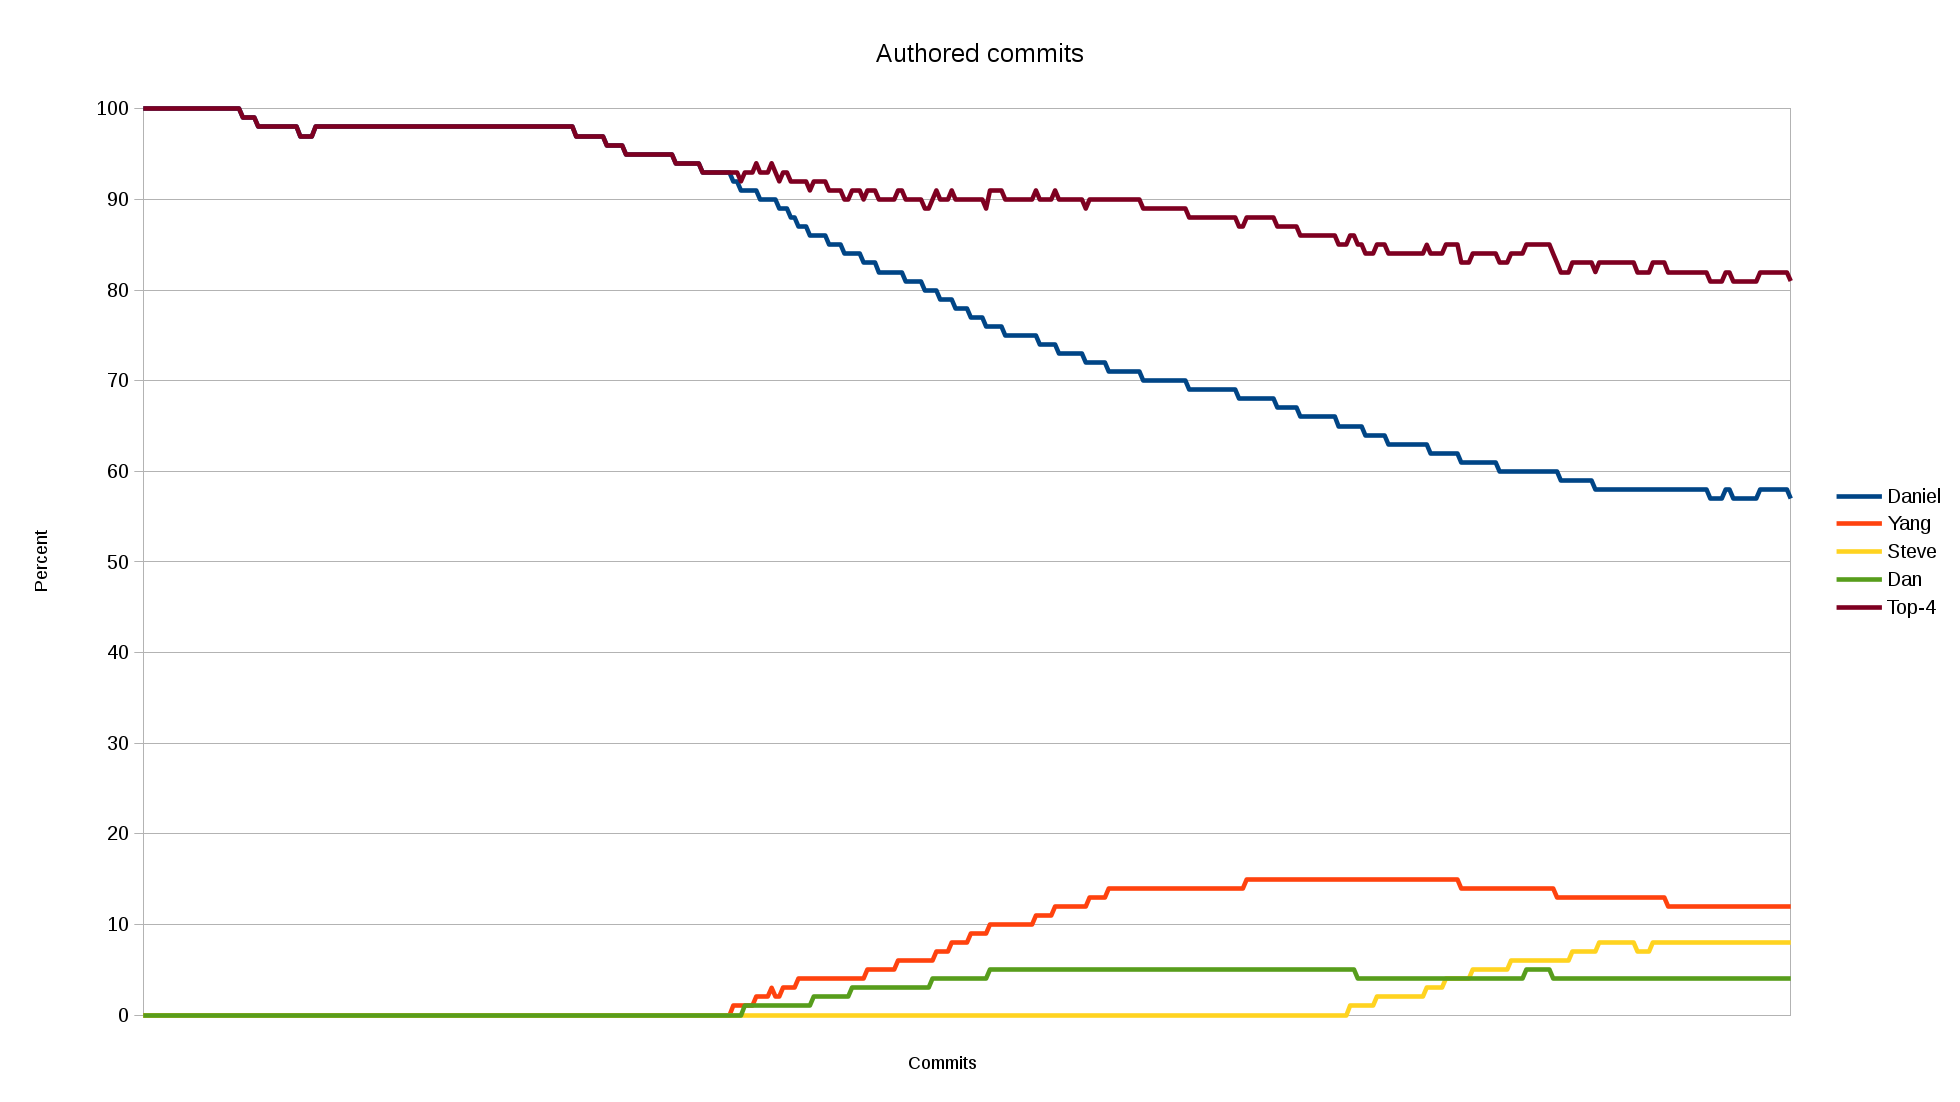
Top-4 author’s share
This could also talk about how seriously we suffer from “the bus factor” in this project. Look at how large share of all commits that the top-4 commiters have authored. Not committed; authored. Of course we didn’t have proper separation between authors and committers before git (March 2010).
Interesting to note here is also that the author listed second here is Yang Tse, who hasn’t authored anything since August 2013. Me personally seem to have plateaued at around 57% of all commits during the recent year or two and the top-4 share is slowly decreasing but is still over 80% of the commits.
I hope we can get the top-4 share well below 80% if I rerun this script next year!
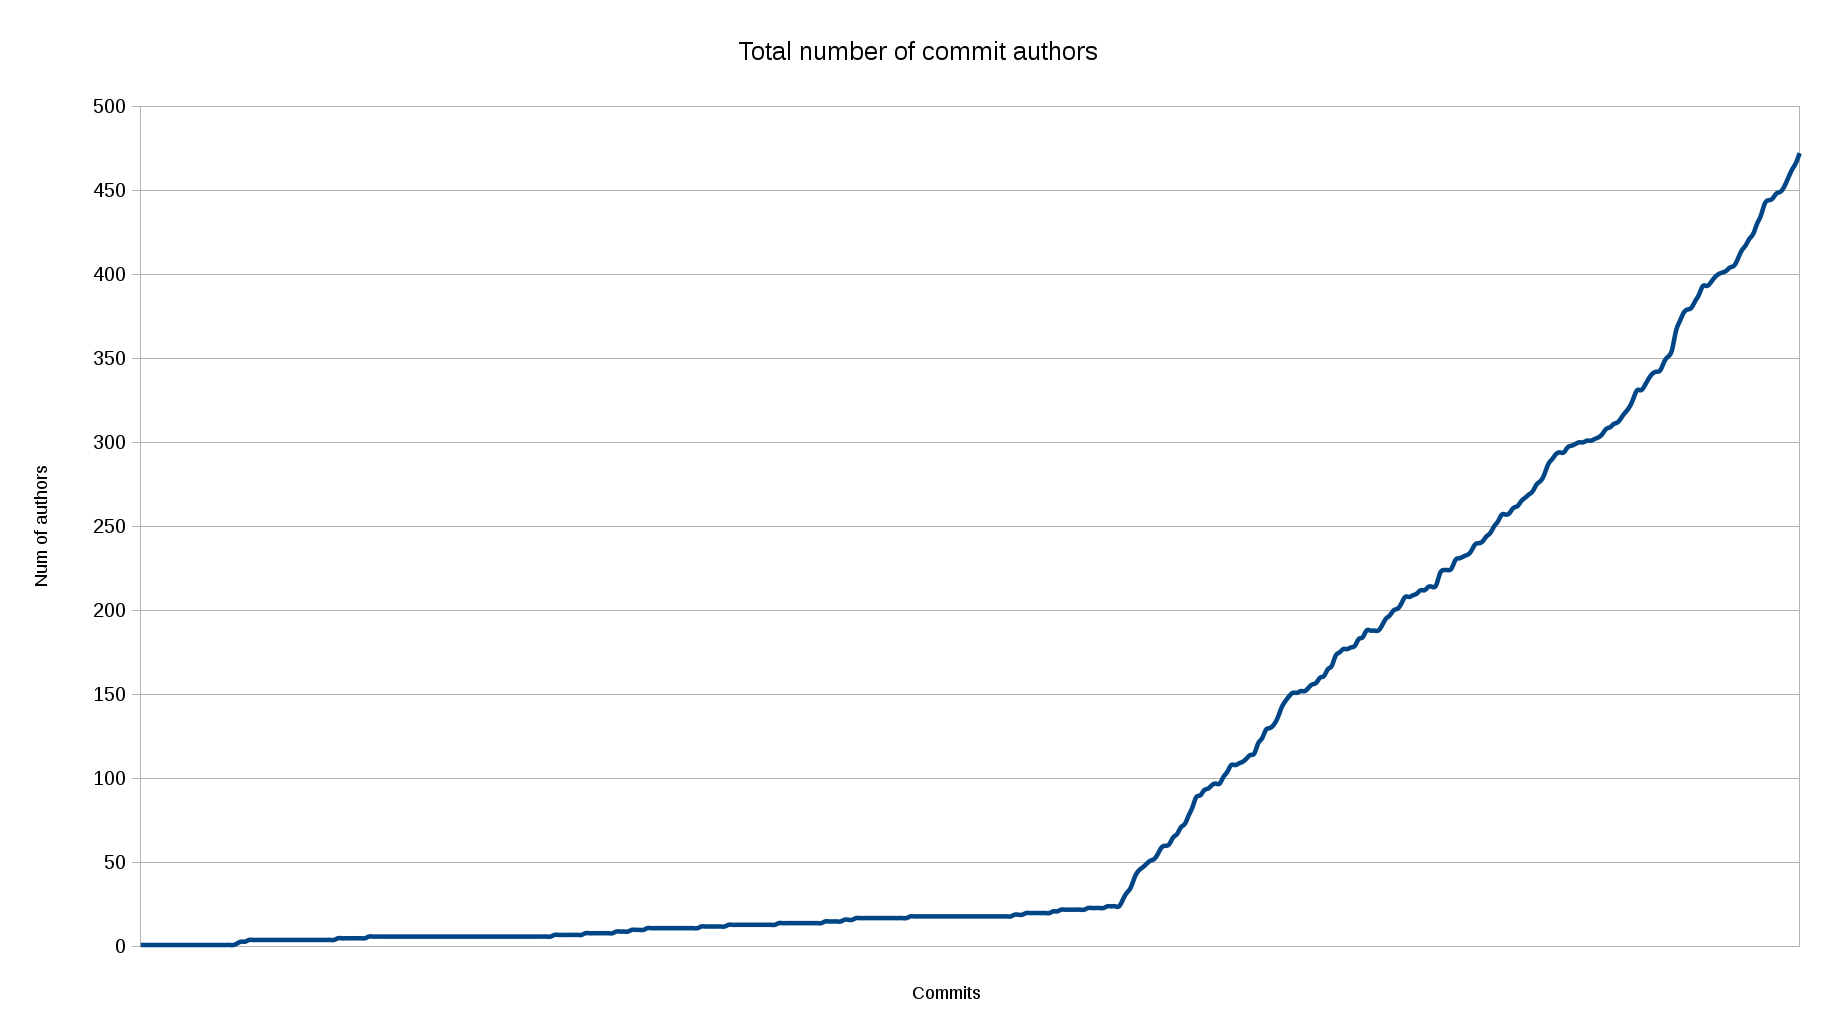
Number of authors over time
In comparison to the above graph, I did one that simply counted the total number of unique authors that have contributed a change to git and look at how that number changes over time.
The time before git is, again, somewhat of a lie since we didn’t keep track of authors vs committers properly then so we shouldn’t put too much value into that significant knee we can see on the graph.
To me, the main take away is that in spite of the top-4 graph above, this authors-over-time line is interestingly linear and shows that the vast majority of people who contribute patches only send in one or maybe a couple of changes and then never appear again in the project.
My hope is that this line will continue to climb over the coming years.
Commits per release
We started doing proper git tags for release for curl 6.5. So how many commits have we done between releases ever since? It seems to have gone up and down over time and I added an average number line in this graph which is at about 150 commits per release (and remember that we attempt to do them every 8 weeks since a few years back).
Towards the right we can see the last 20 releases or so showing a pattern of high bar, low bar, and I’ll get to that more in a coming graph.
Of course, counting commits is a rough measurement as they can be big or small, easy or hard, good or bad and this only counts them.

Commits per day
As the release frequency has varied a bit over time I figured I should just check and see how many commits we do in the project per day and see how that has changed (or not) over time. Remember, we are increasing the number of unique authors fairly fast but the top-4 share of “authorship” is fairly stable.
Turns our the number of commits per day has gone up and down a little bit through the git history but I can’t spot any obvious trend here. In recent years we seem to keep up more than 2 commits per day and during intense periods up to 8.
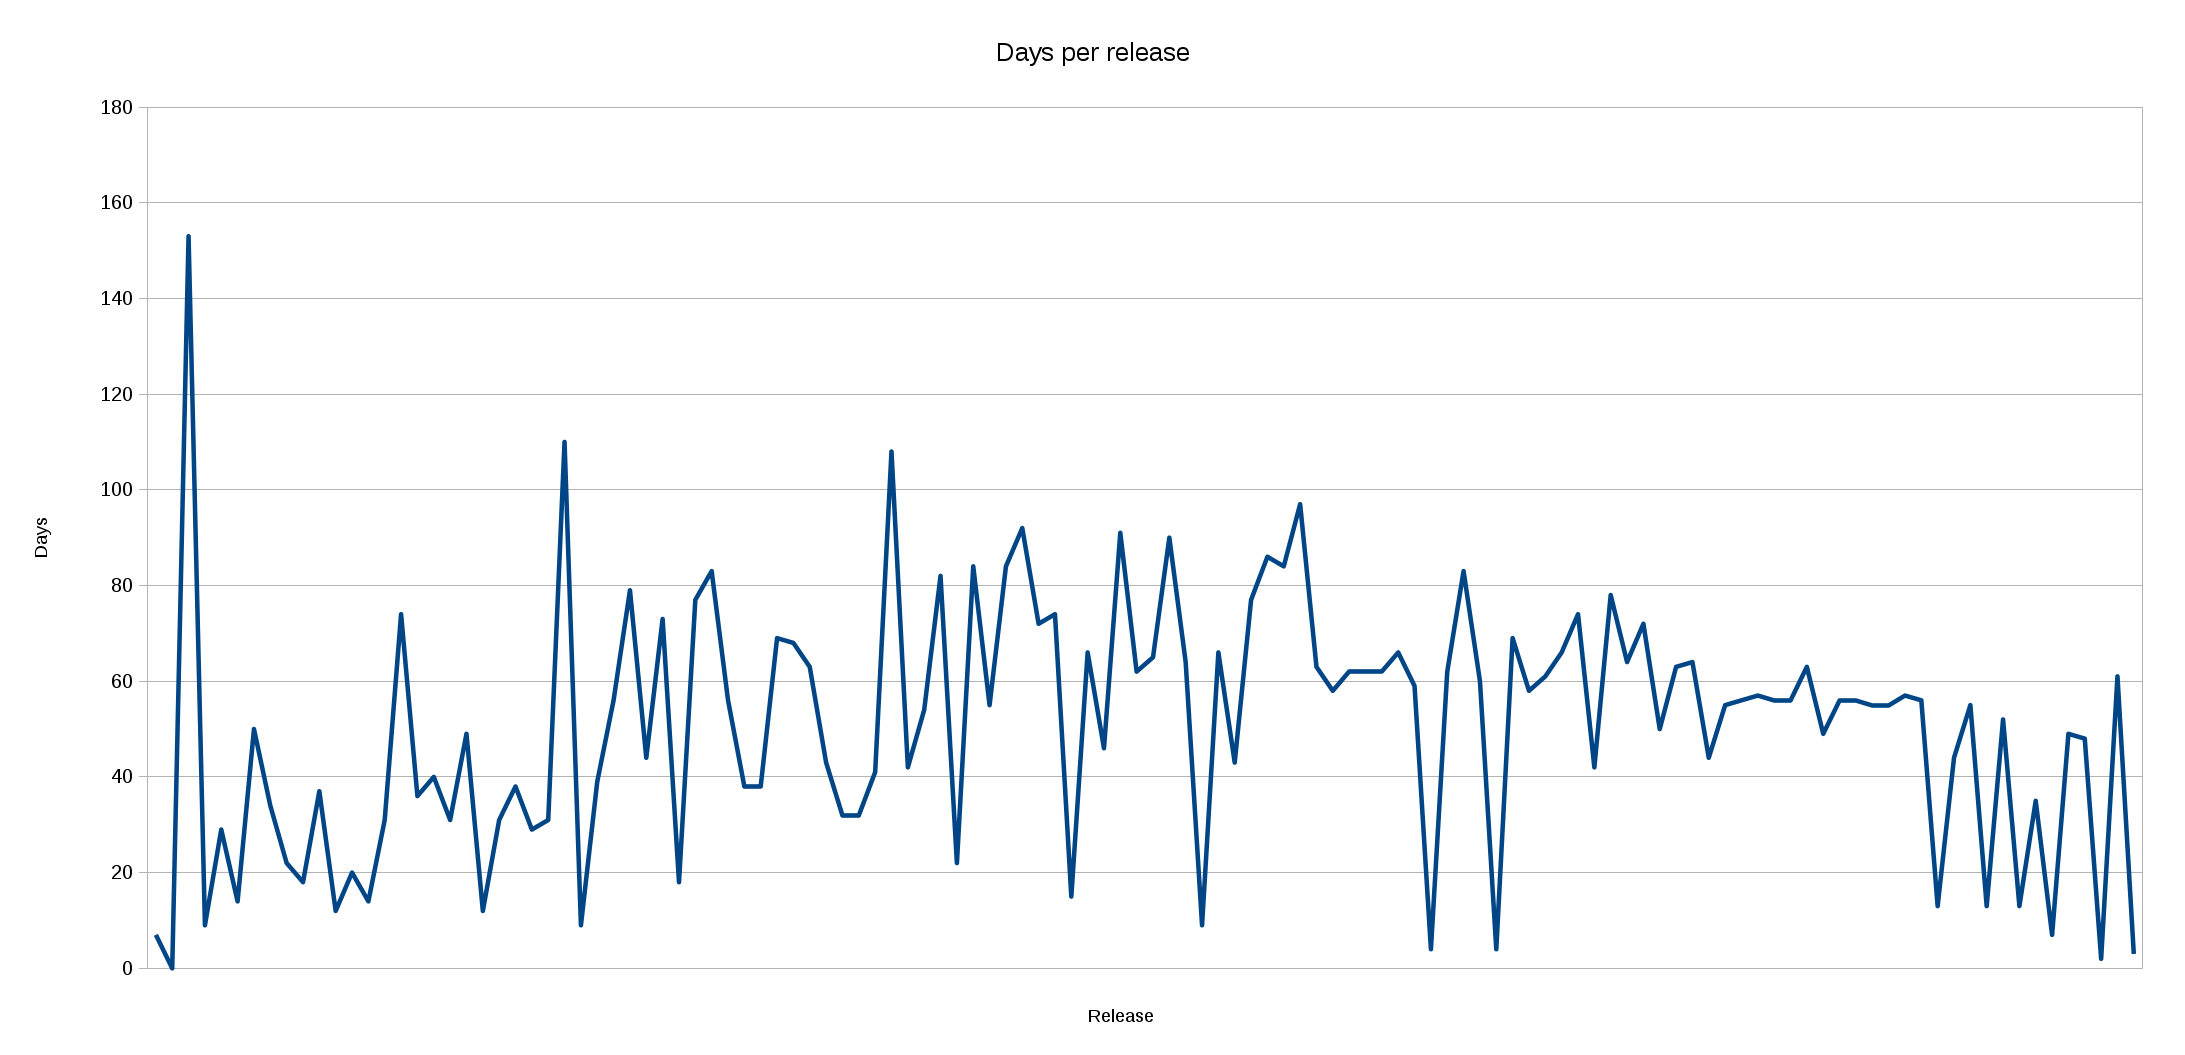
Days per release
Our general plan is since bunch of years back to do releases every 8 weeks like a clock work. 8 weeks is 56 days.
When we run into serious problems, like bugs that are really annoying or tedious to users or if we get a really serious security problem reported, we sometimes decide to go outside of the regular release schedule and ship something before the end of the 8-week cycle.
This graph clearly shows that over the last, say 20, releases we clearly have felt ourselves “forced” to do follow-up releases outside of the regular schedule. The right end of the graph shows a very clear saw-tooth look that proves this.
We’ve also discussed this slightly on the mailing list recently, and I’m certainly willing to go back and listen to people as to what we can do to improve this situation.
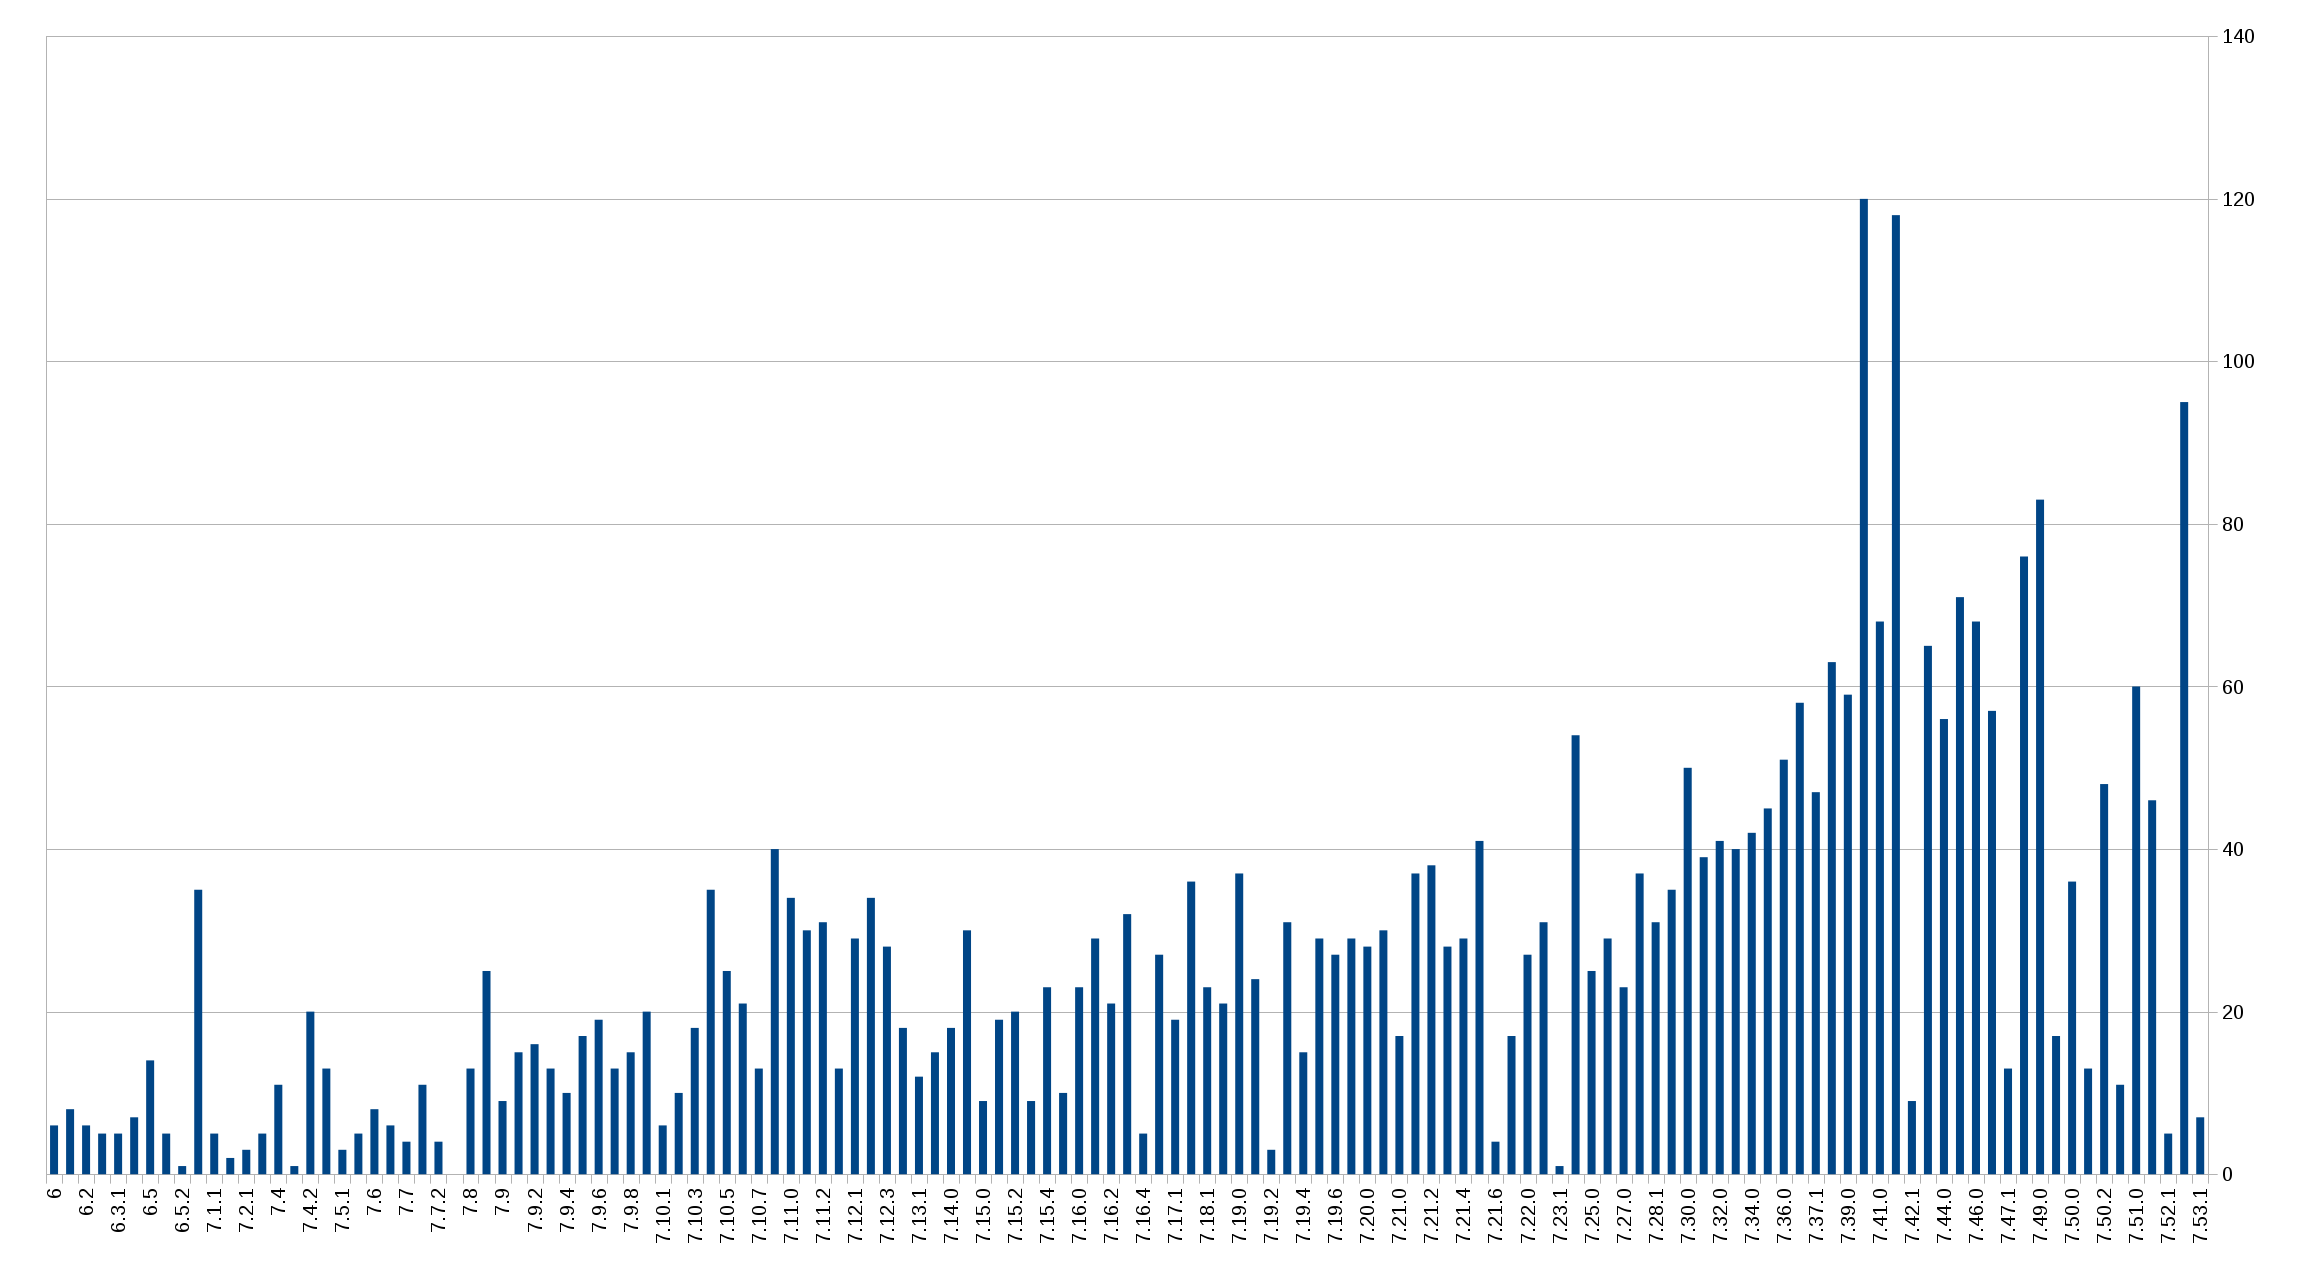
Bugfixes per release
We keep close track of all bugfixes done in git and mark them up and mention them in the RELEASE-NOTES document that we ship in every new release.
This makes it possible for us to go back and see how many bug fixes we’ve recorded for each release since curl 6.5. This shows a clear growth over time. It’s interesting since we don’t see this when we count commits, so it may just be attributed to having gotten better at recording the bugs in the files. Or that we now spend fewer commits per bug fix. Hard to tell exactly, but I do enjoy that we fix a lot of bugs…
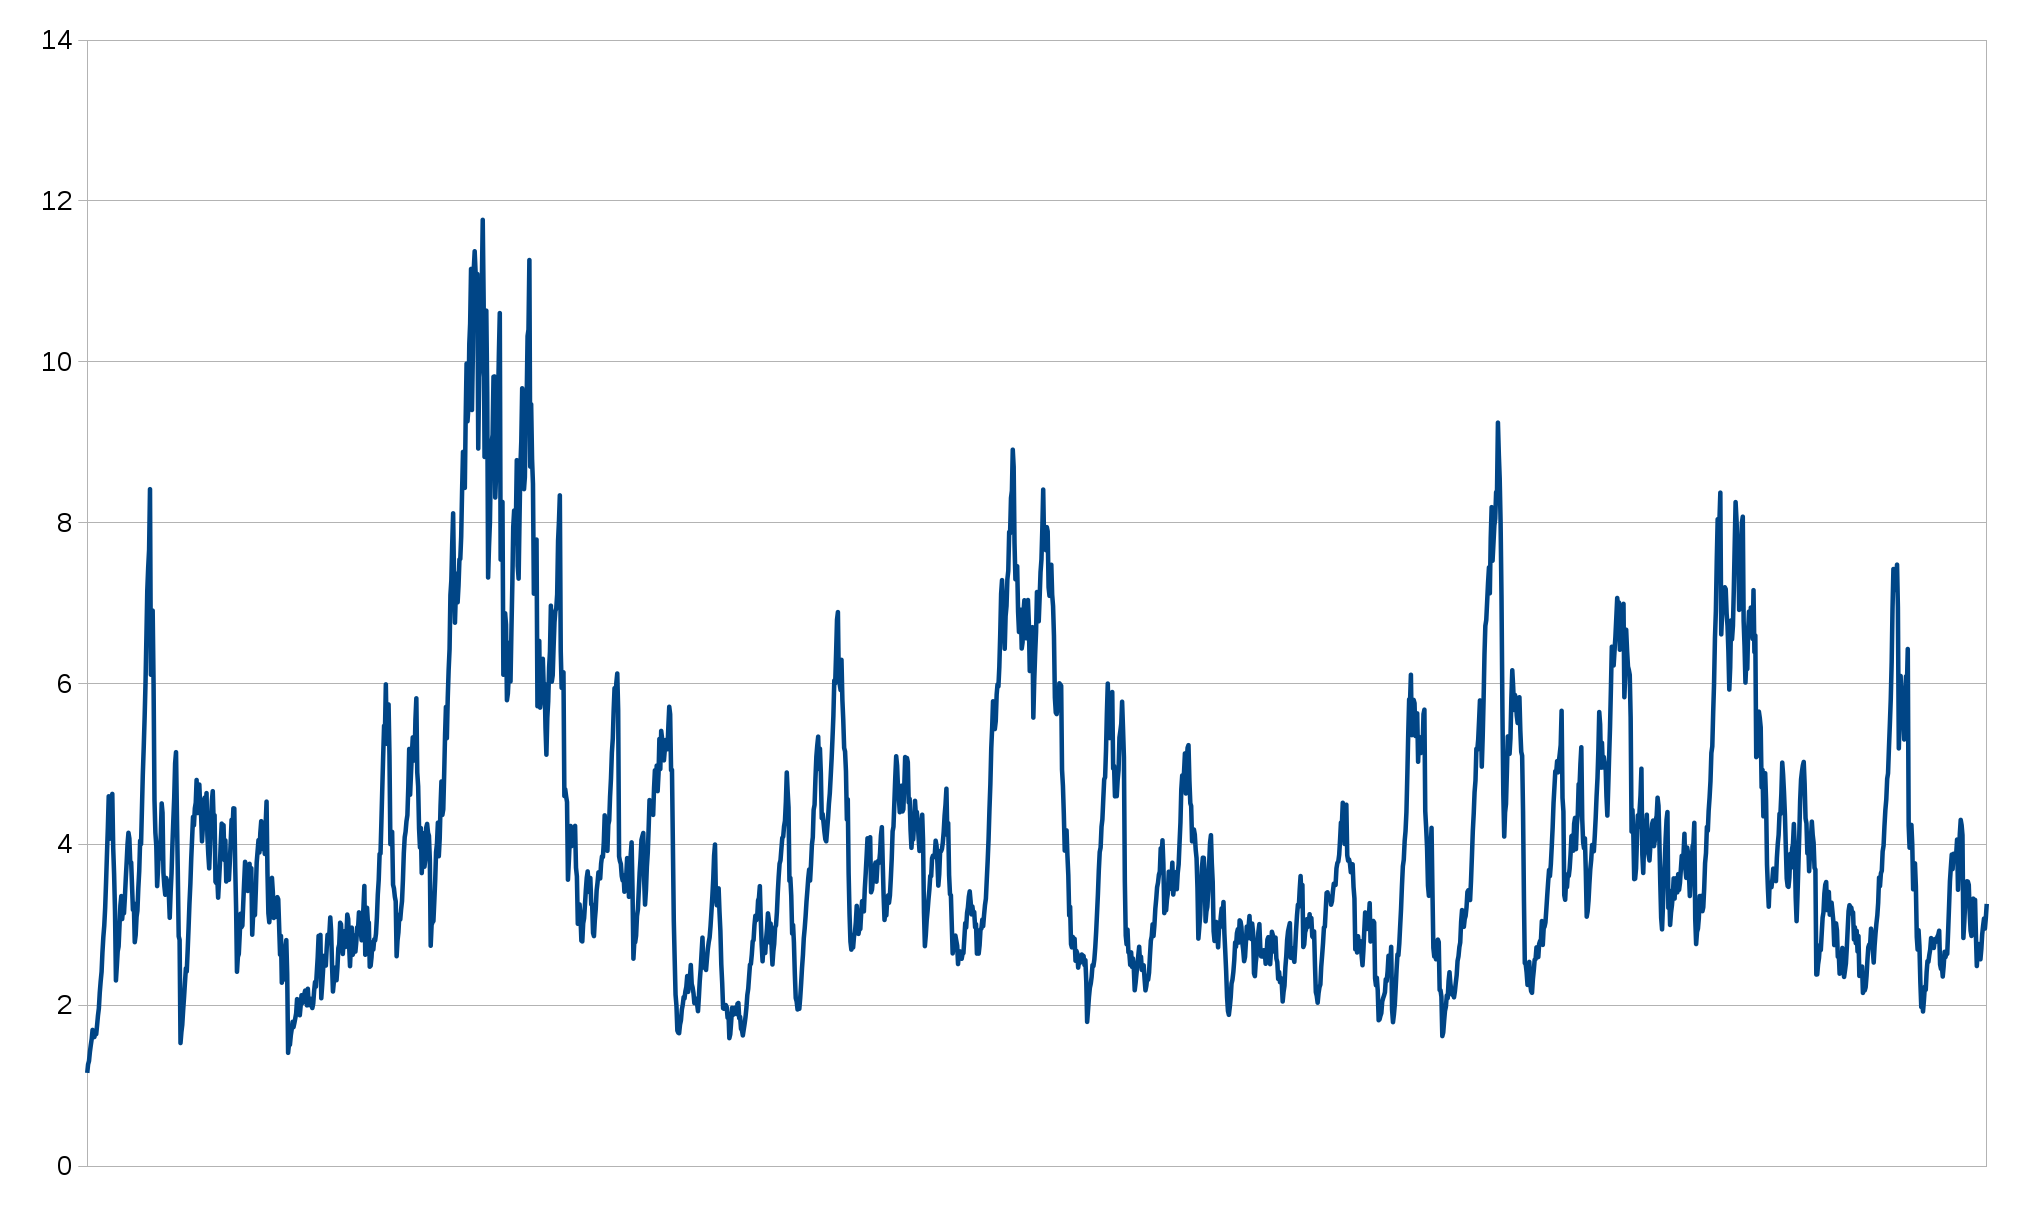
Days spent per bugfix
Another way to see the data above is to count the number of bug fixes we do over time and just see how many days we need on average to fix bugs.
The last few years we do more bug fixes than there are days so if we keep up the trend this shows for 2017 we might be able to reach down to 0.5 days per bug fix on average. That’d be cool!
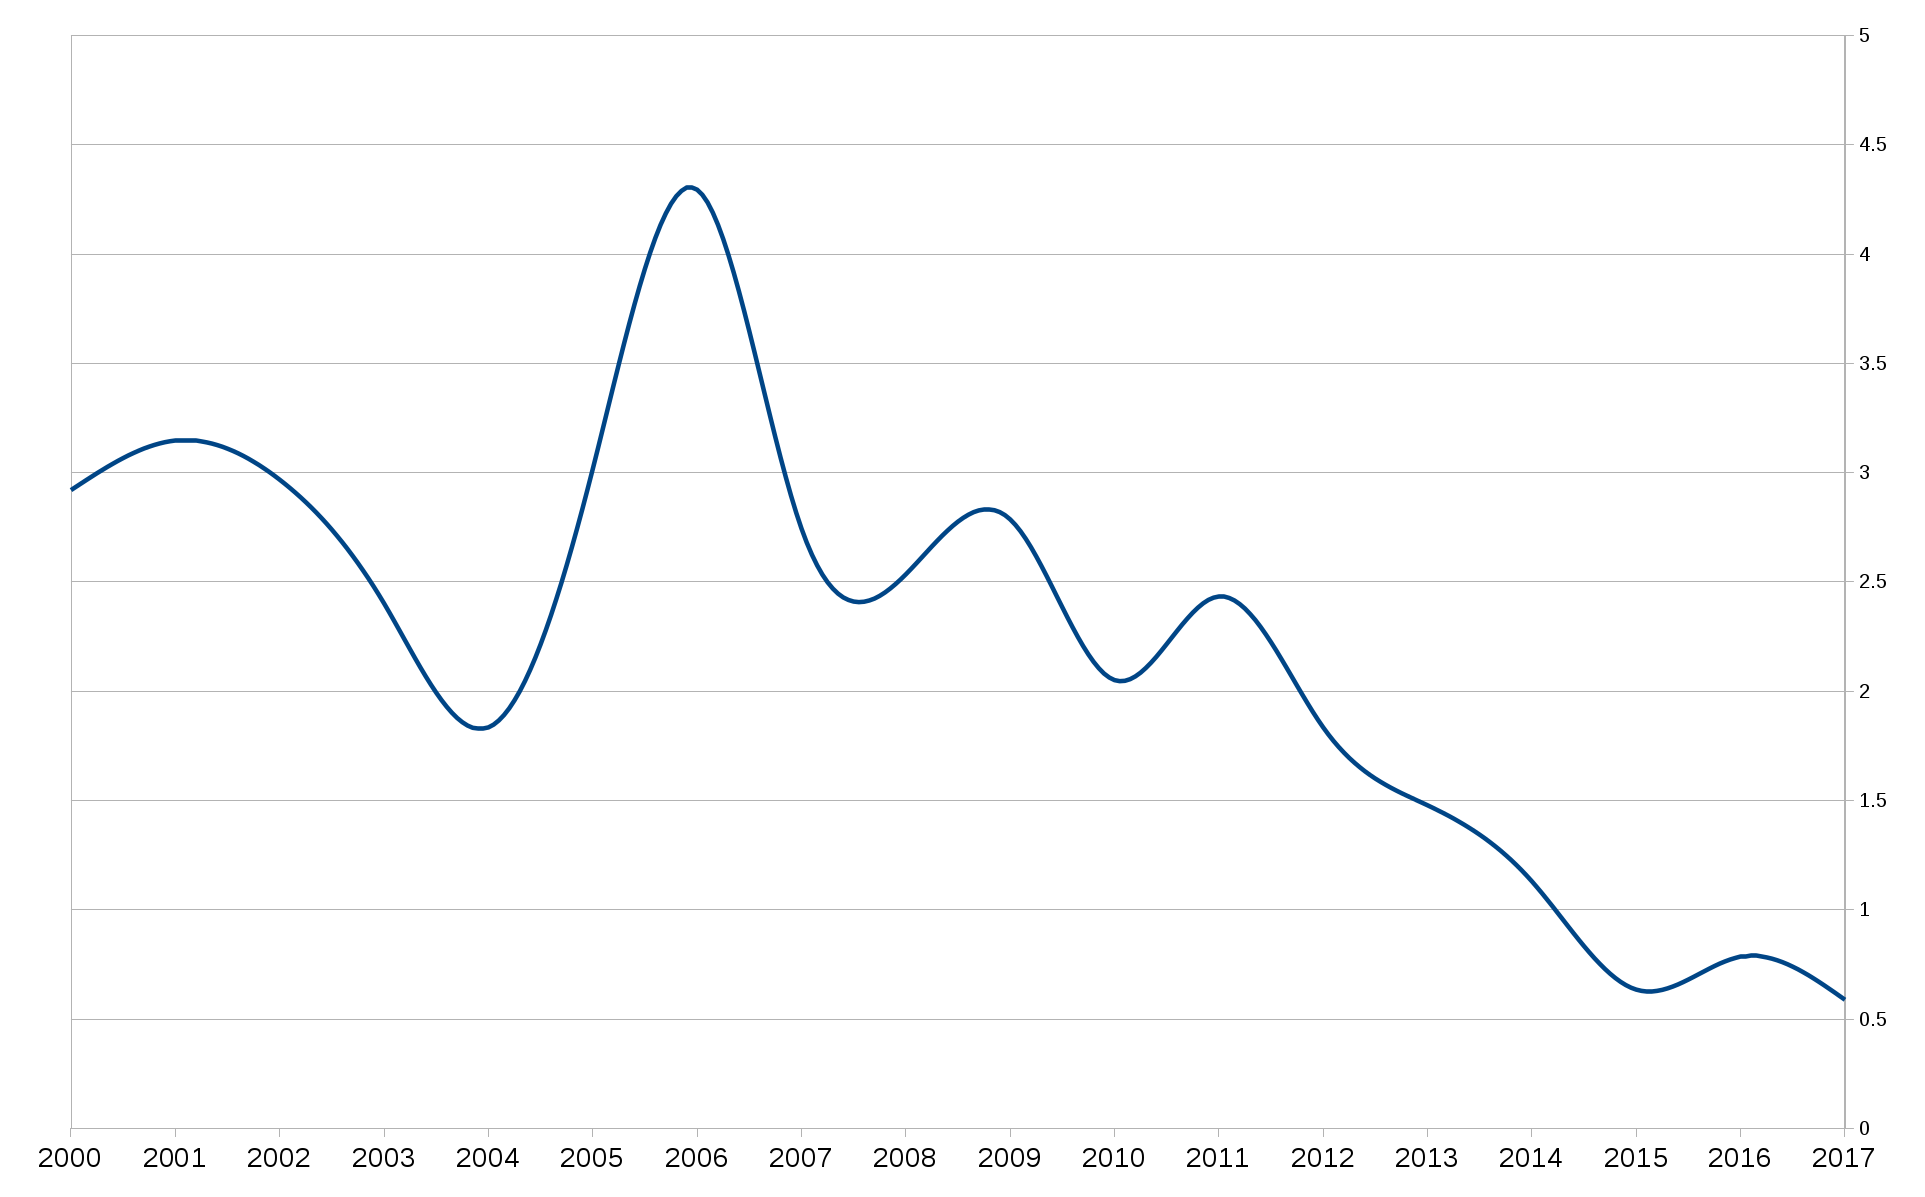
Coverity scans
We run coverity scans on the curl cover regularly and this service keeps a little graph for us showing the number of found defects over time. These days we have a policy of never allowing a defect detected by Coverity to linger around. We fix them all and we should have zero detected defects at all times.
The second graph here shows a comparison line with “other projects of comparable size”, indicating that we’re at least not doing badly here.

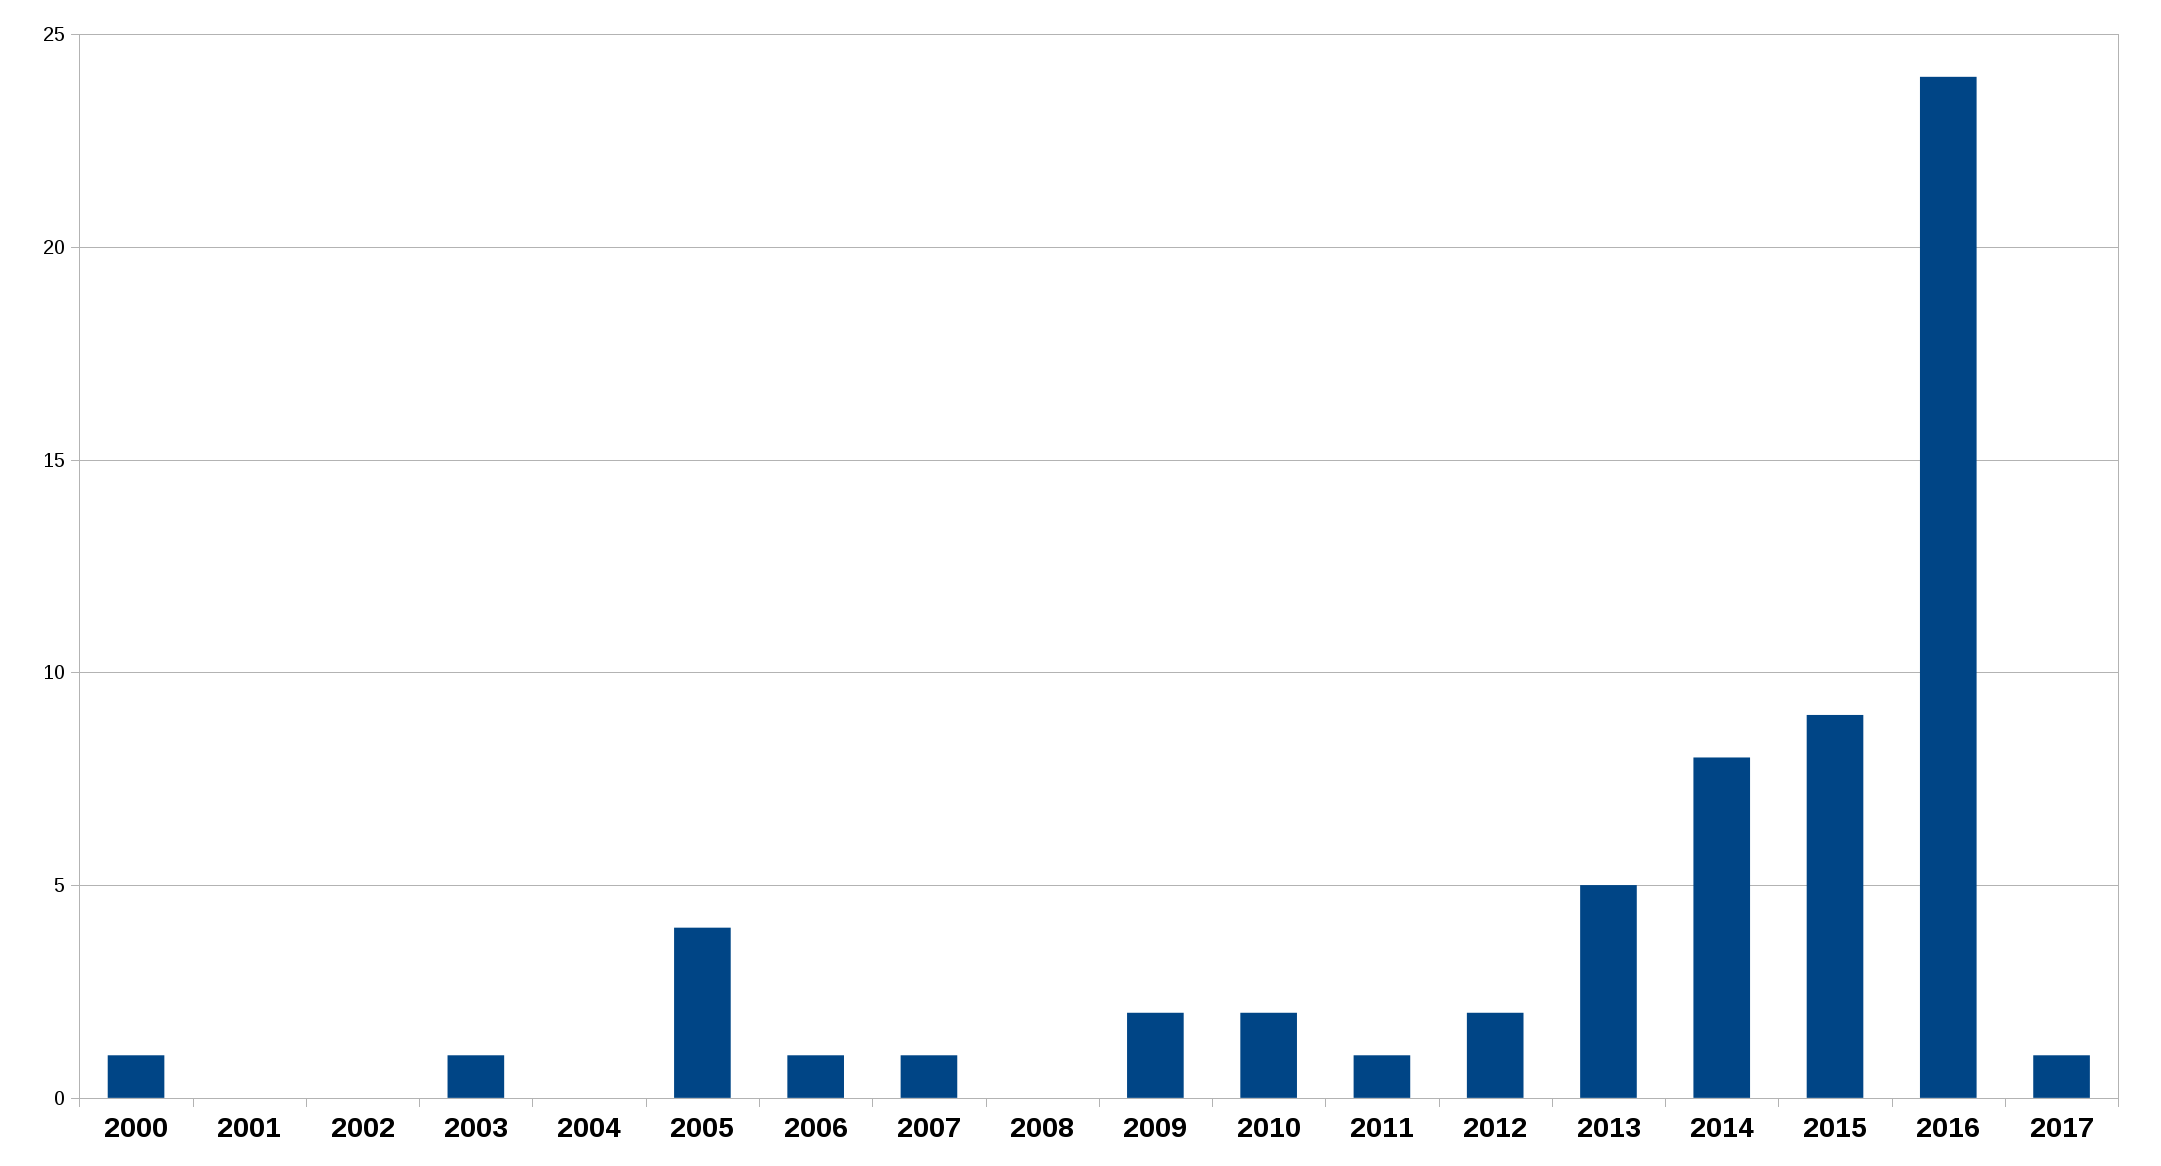
Vulnerability reports
So in spite of our grand intentions and track record shown above, people keep finding security problems in curl in a higher frequency than every before.
Out of the 24 vulnerabilities reported to the curl project in 2016, 7 was the result of the special security audit that we explicitly asked for, but even if we hadn’t asked for that and they would’ve remained unknown, 17 would still have stood out in this graph.
I do however think that finding – and reporting – security problem is generally more good than bad. The problems these reports have found have generally been around for many years already so this is not a sign of us getting more sloppy in recent years, I take it as a sign that people look for these problems better and report them more often, than before. The industry as a whole looks on security problems and the importance of them differently now than it did years ago.