
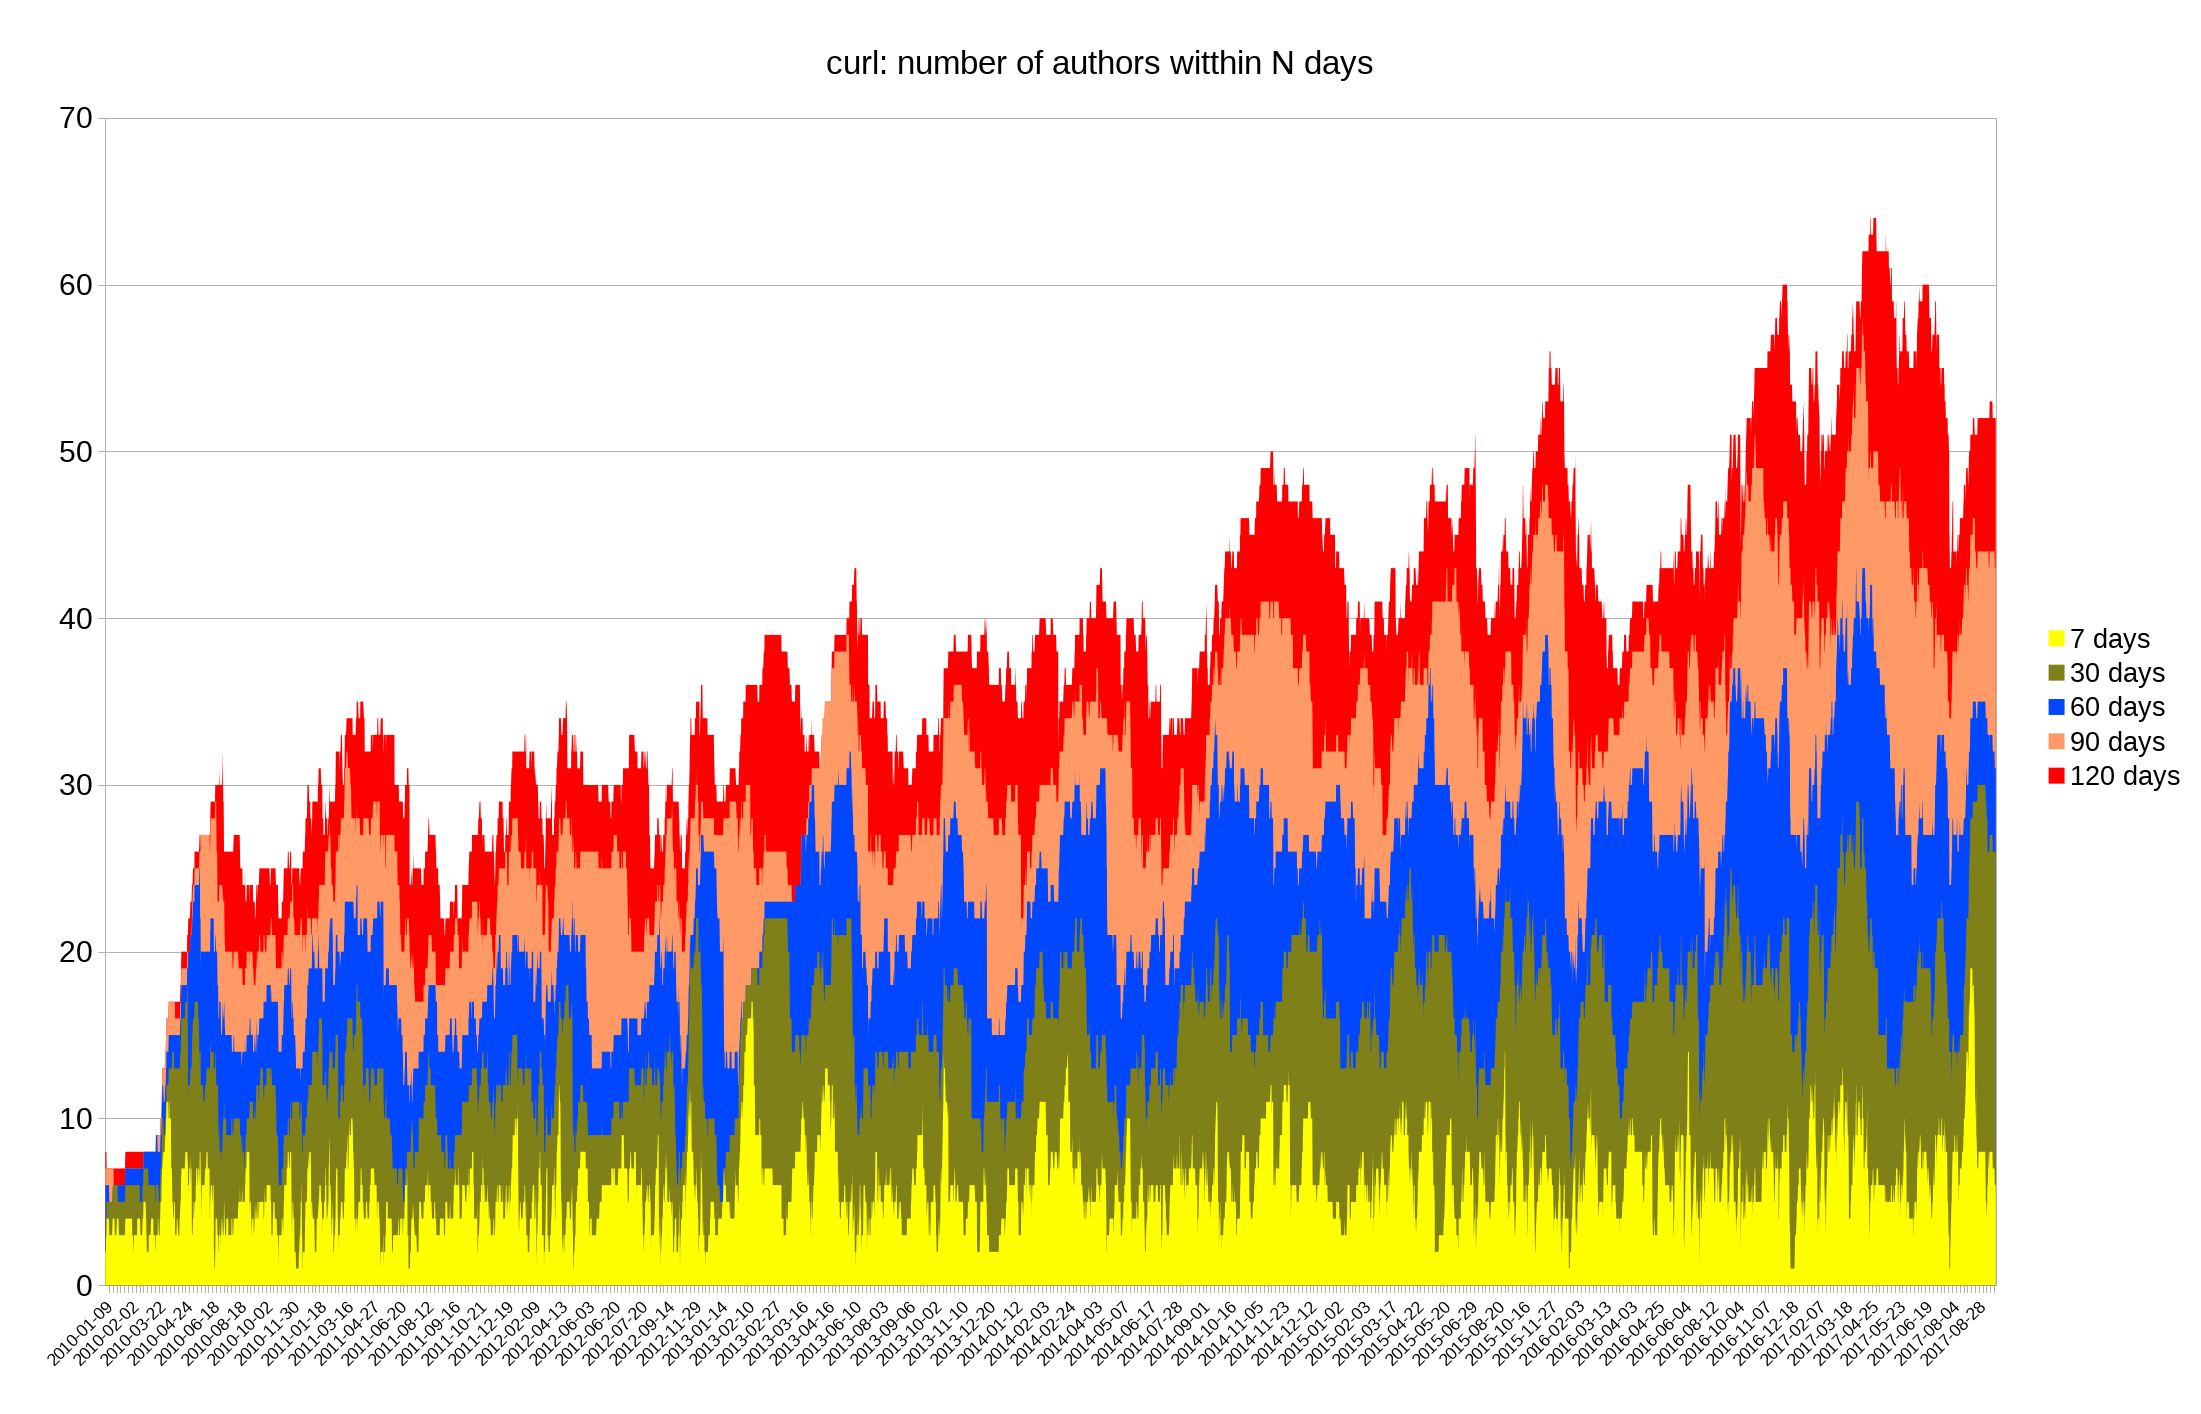
At the time of each commit, check how many unique authors that had a change committed within the previous 120, 90, 60, 30 and 7 days. Run the script on the curl git repository and then plot a graph of the data, ranging from 2010 until today. This is just under 10,000 commits.
(click for the full resolution version)
git-authors-active.pl is the little stand-alone script I wrote and used for this – should work fine for any git repository. I then made the graph from that using libreoffice.