
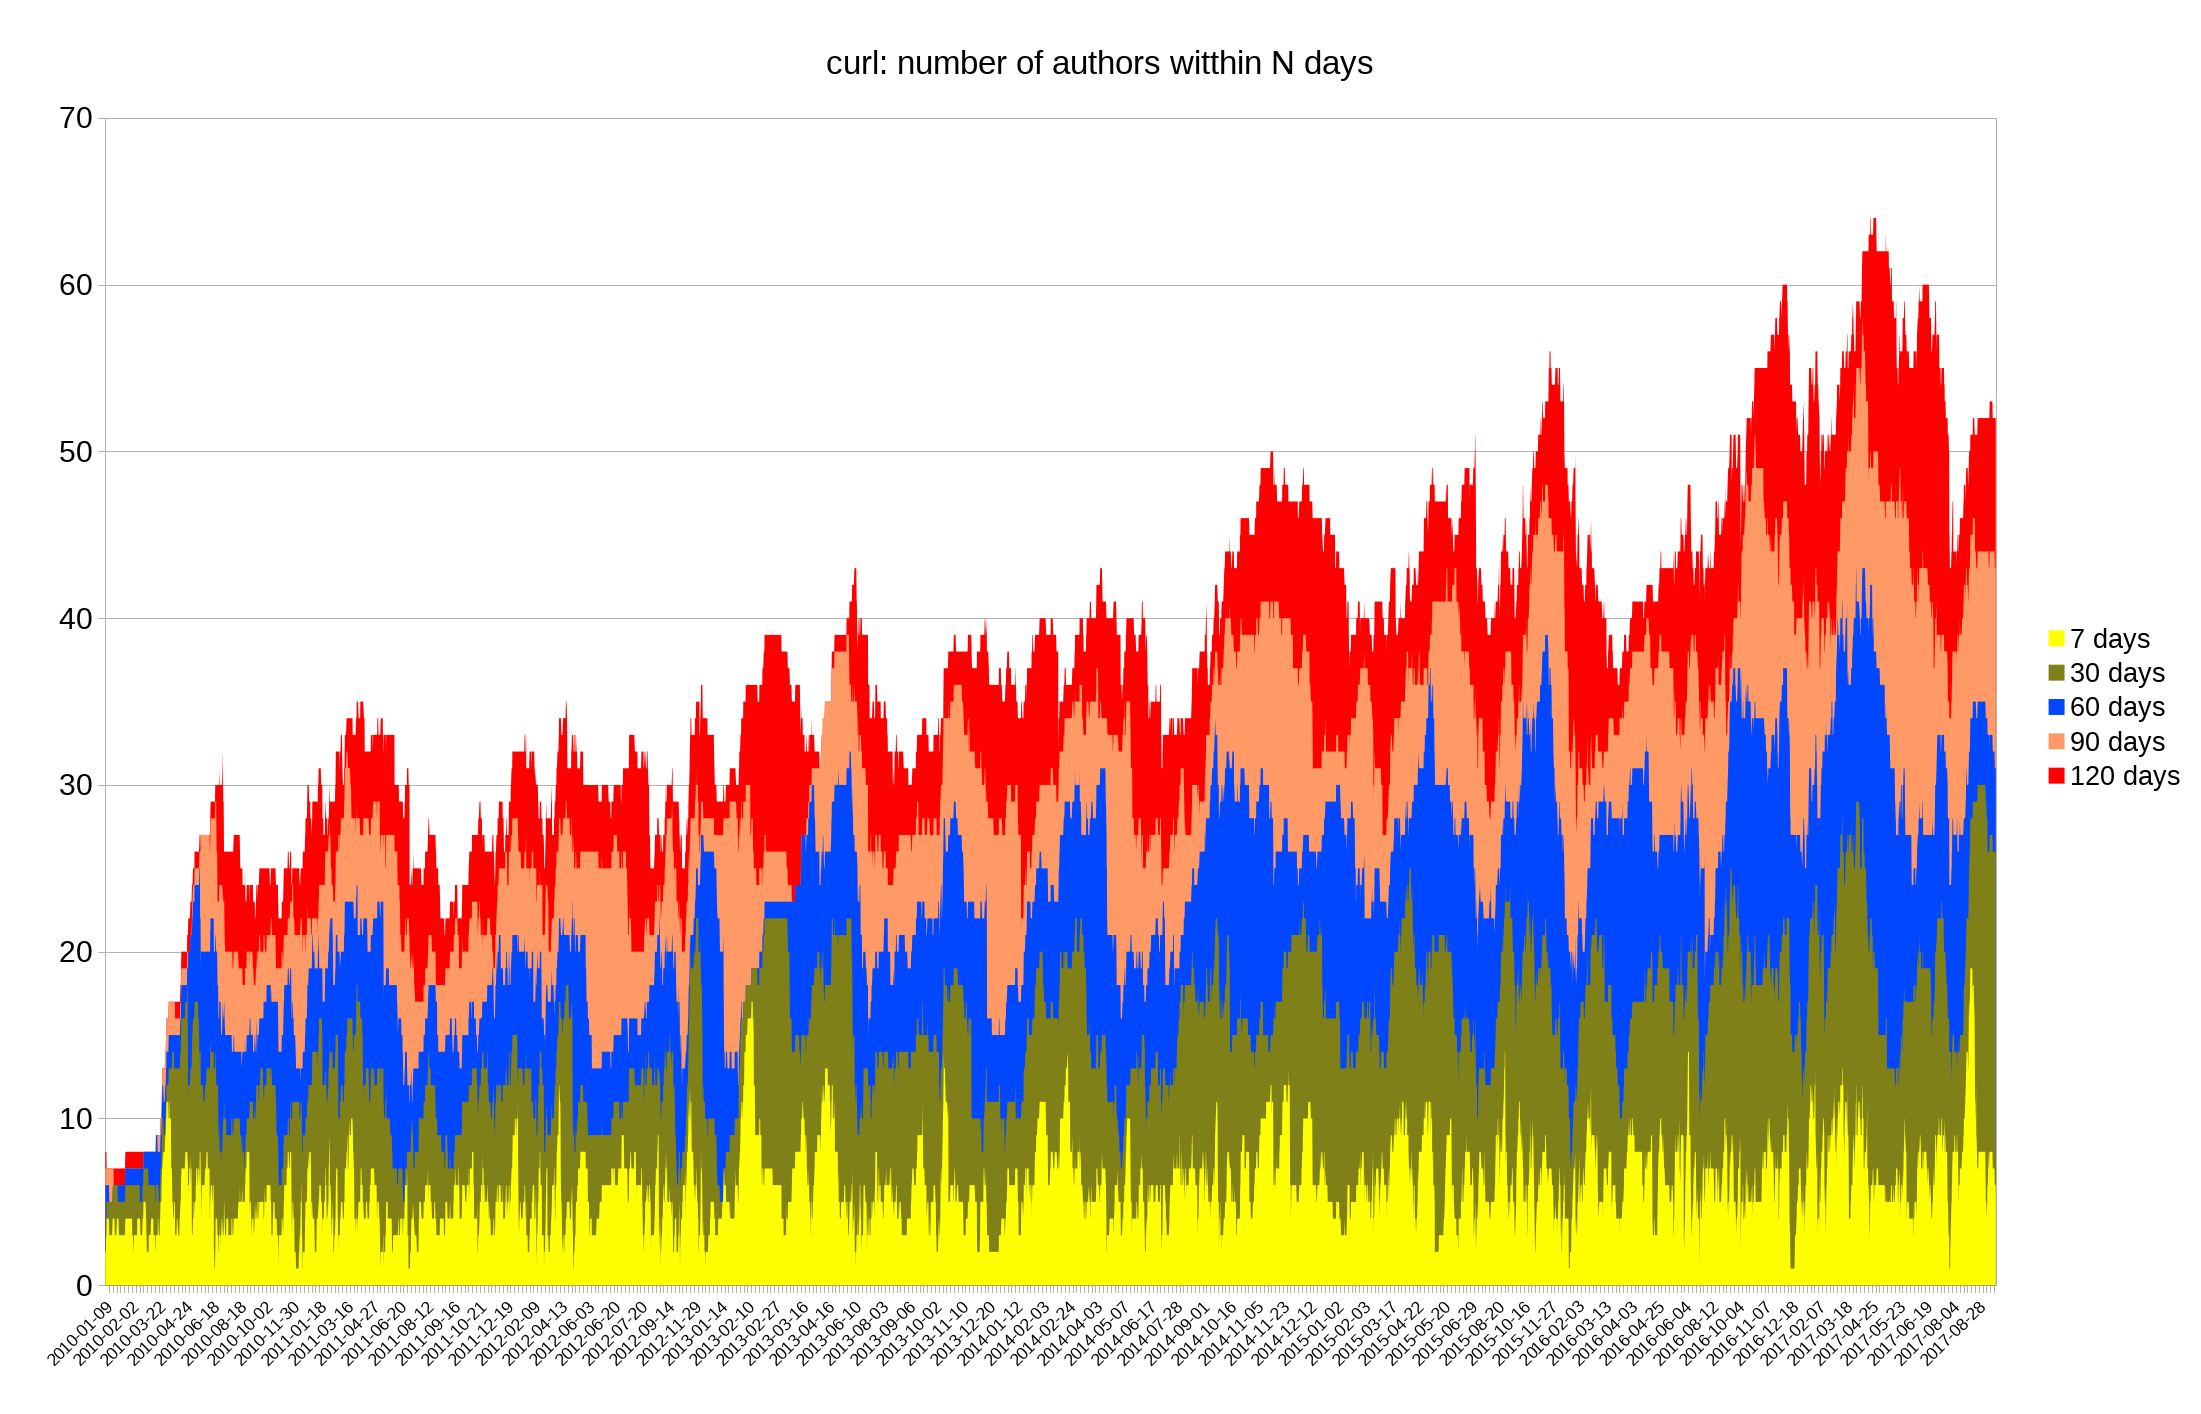
At the time of each commit, check how many unique authors that had a change committed within the previous 120, 90, 60, 30 and 7 days. Run the script on the curl git repository and then plot a graph of the data, ranging from 2010 until today. This is just under 10,000 commits.
(click for the full resolution version)
git-authors-active.pl is the little stand-alone script I wrote and used for this – should work fine for any git repository. I then made the graph from that using libreoffice.
For anyone trying this at home: the git log invocation has two –reverse options, which cancel out. Remove one of them (or add an odd number more!), or the output will be wrong.
You’ll likely also want to remove duplicate lines (I piped the thing through uniq).
I’ve removed the double –reverse now.
Regarding duplicate lines, I left them in since I wanted the output to be exactly one line per commit.