The never-ending series of curl releases continued today when we released version 7.57.0. The 171th release since the beginning, and the release that follows 37 days after 7.56.1. Remember that 7.56.1 was an extra release that fixed a few most annoying regressions.
We bump the minor number to 57 and clear the patch number in this release due to the changes introduced. None of them very ground breaking, but fun and useful and detailed below.
41 contributors helped fix 69 bugs in these 37 days since the previous release, using 115 separate commits. 23 of those contributors were new, making the total list of contributors now contain 1649 individuals! 25 individuals authored commits since the previous release, making the total number of authors 540 persons.
The curl web site currently sends out 8GB data per hour to over 2 million HTTP requests per day.
Support RFC7616 – HTTP Digest
This allows HTTP Digest authentication to use the must better SHA256 algorithm instead of the old, and deemed unsuitable, MD5. This should be a transparent improvement so curl should just be able to use this without any particular new option has to be set, but the server-side support for this version seems to still be a bit lacking.
(Side-note: I’m credited in RFC 7616 for having contributed my thoughts!)
Sharing the connection cache
In this modern age with multi core processors and applications using multi-threaded designs, we of course want libcurl to enable applications to be able to get the best performance out of libcurl.
libcurl is already thread-safe so you can run parallel transfers multi-threaded perfectly fine if you want to, but it doesn’t allow the application to share handles between threads. Before this specific change, this limitation has forced multi-threaded applications to be satisfied with letting libcurl has a separate “connection cache” in each thread.
The connection cache, sometimes also referred to as the connection pool, is where libcurl keeps live connections that were previously used for a transfer and still haven’t been closed, so that a subsequent request might be able to re-use one of them. Getting a re-used connection for a request is much faster than having to create a new one. Having one connection cache per thread, is ineffective.
Starting now, libcurl’s “share concept” allows an application to specify a single connection cache to be used cross-thread and cross-handles, so that connection re-use will be much improved when libcurl is used multi-threaded. This will significantly benefit the most demanding libcurl applications, but it will also allow more flexible designs as now the connection pool can be designed to survive individual handles in a way that wasn’t previously possible.
Brotli compression
The popular browsers have supported brotli compression method for a while and it has already become widely supported by servers.
Now, curl supports it too and the command line tool’s –compressed option will ask for brotli as well as gzip, if your build supports it. Similarly, libcurl supports it with its CURLOPT_ACCEPT_ENCODING option. The server can then opt to respond using either compression format, depending on what it knows.
According to CertSimple, who ran tests on the top-1000 sites of the Internet, brotli gets contents 14-21% smaller than gzip.
As with other compression algorithms, libcurl uses a 3rd party library for brotli compression and you may find that Linux distributions and others are a bit behind in shipping packages for a brotli decompression library. Please join in and help this happen. At the moment of this writing, the Debian package is only available in experimental.
(Readers may remember my libbrotli project, but that effort isn’t really needed anymore since the brotli project itself builds a library these days.)
Three security issues
In spite of our hard work and best efforts, security issues keep getting reported and we fix them accordingly. This release has three new ones and I’ll describe them below. None of them are alarmingly serious and they will probably not hurt anyone badly.
Two things can be said about the security issues this time:
1. You’ll note that we’ve changed naming convention for the advisory URLs, so that they now have a random component. This is to reduce potential information leaks based on the name when we pass these around before releases.
2. Two of the flaws happen only on 32 bit systems, which reveals a weakness in our testing. Most of our CI tests, torture tests and fuzzing are made on 64 bit architectures. We have no immediate and good fix for this, but this is something we must work harder on.
1. NTLM buffer overflow via integer overflow
(CVE-2017-8816) Limited to 32 bit systems, this is a flaw where curl takes the combined length of the user name and password, doubles it, and allocates a memory area that big. If that doubling ends up larger than 4GB, an integer overflow makes a very small buffer be allocated instead and then curl will overwrite that.
Yes, having user name plus password be longer than two gigabytes is rather excessive and I hope very few applications would allow this.
2. FTP wildcard out of bounds read
(CVE-2017-8817) curl’s wildcard functionality for FTP transfers is not a not very widely used feature, but it was discovered that the default pattern matching function could erroneously read beyond the URL buffer if the match pattern ends with an open bracket ‘[‘ !
This problem was detected by the OSS-Fuzz project! This flaw has existed in the code since this feature was added, over seven years ago.
3. SSL out of buffer access
(CVE-2017-8818) In July this year we introduced multissl support in libcurl. This allows an application to select which TLS backend libcurl should use, if it was built to support more than one. It was a fairly large overhaul to the TLS code in curl and unfortunately it also brought this bug.
Also, only happening on 32 bit systems, libcurl would allocate a buffer that was 4 bytes too small for the TLS backend’s data which would lead to the TLS library accessing and using data outside of the heap allocated buffer.
Next?
The next release will ship no later than January 24th 2018. I think that one will as well add changes and warrant the minor number to bump. We have fun pending stuff such as: a new SSH backend, modifiable happy eyeballs timeout and more. Get involved and help us do even more good!


 Unless the issue is critical, we prefer to schedule a fix and announcement of the issue in association with the pending next release, and as we do releases every 8 weeks like clockwork, that’s never very far away.
 we should introduce processes, tests and checks to make sure we detect other similar mistakes now and in the future.
 Unfortunately we don’t have any bug bounties on our own in the curl project. We simply have no money for that. We actually don’t have money at all for anything.


 I think the highest risk scenario is when users download pre-built curl or libcurl binaries from various places on the internet that isn’t the official curl web site. How can you know for sure what you’re getting then, as you couldn’t review the code or changes done. You just put your trust in a remote person or organization to do what’s right for you.
 Some people argue that projects could or should pledge for every release that there’s no deliberate backdoor planted so that if the day comes in the future when a three-letter secret organization forces us to insert a backdoor, the lack of such a pledge for the subsequent release would function as an alarm signal to people that something is wrong.
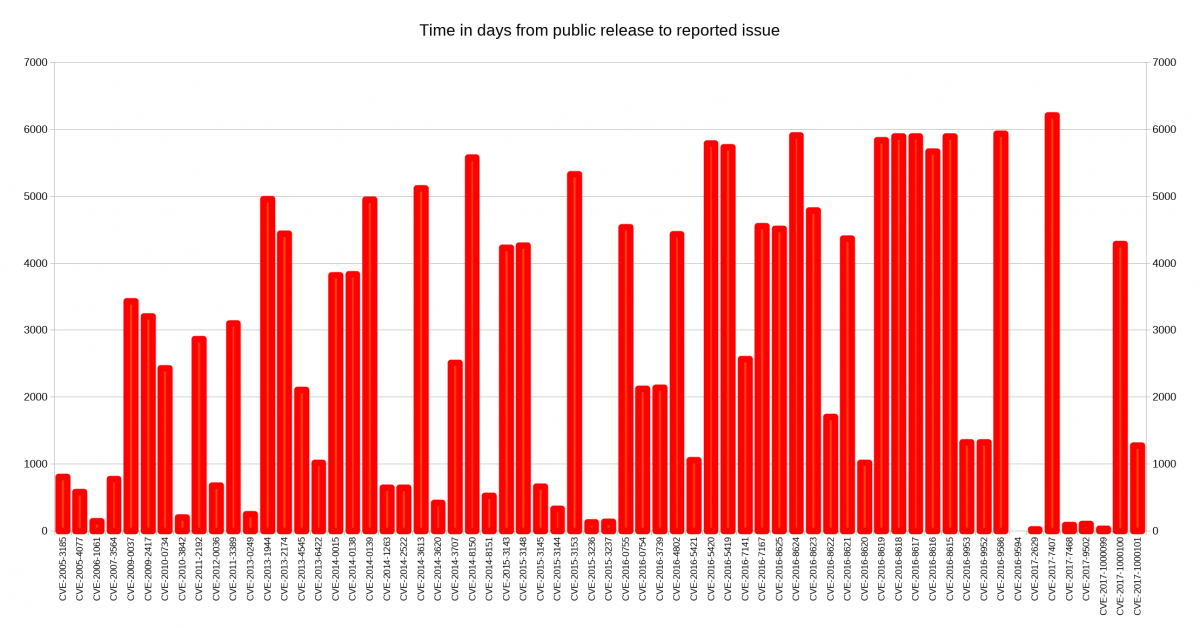
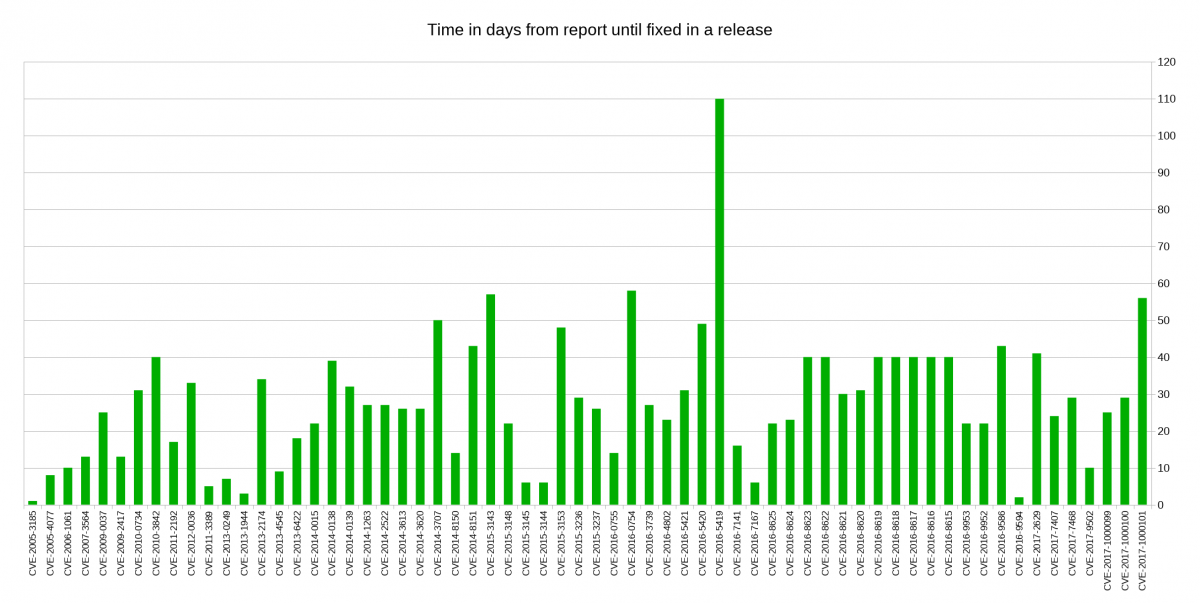
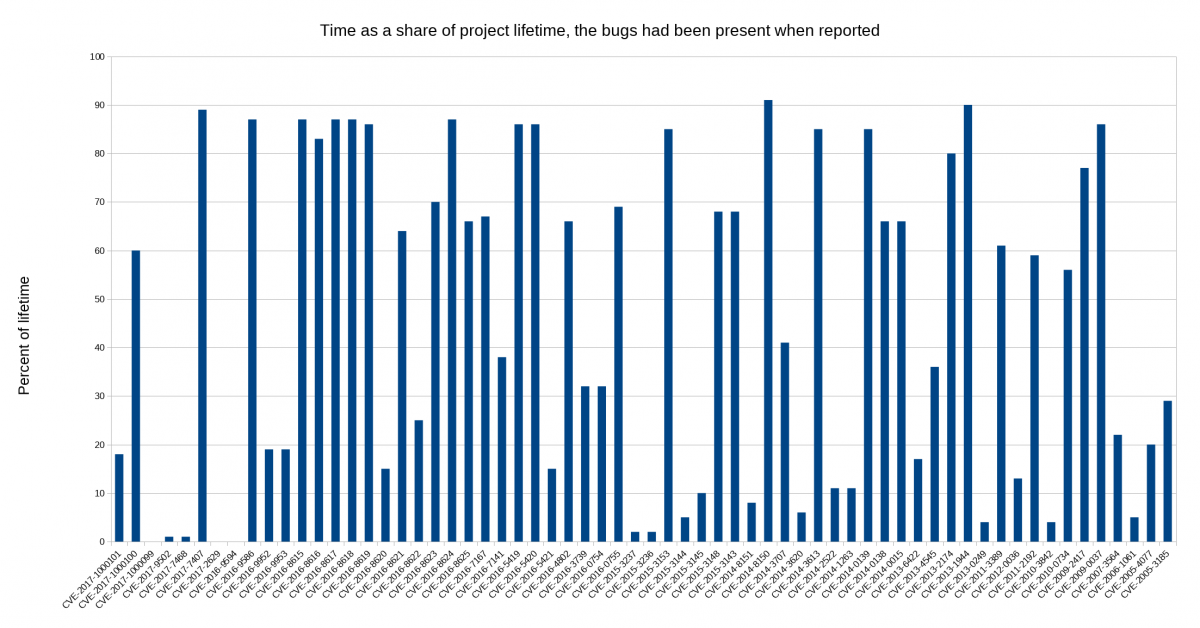
 I decided to look closer at security problems and the age of the reported issues in


 (Season three, episode two)


 observed 2x CPU usage increase for QUIC connections as compared to h2+TLS is mostly blamed on the Linux kernel which apparently is not at all up for this job as good is should be. Things have clearly been more optimized for TCP over the years, leaving room for improvement in the UDP areas going forward. “Making kernel bypassing an interesting choice”.